

 solely $19.99 shipped!")


 Presents at 2025 Treasured Metals Summit – Beaver Creek – Slideshow (TSX:ERD:CA) 2025-09-16")


 Q2 2025 report")


")
tiero
This article was published at iREIT® on Alpha on Wednesday, June 21, 2023. It was coproduced with Dividend Sensei.
Are you feeling frustrated at the AI (artificial intelligence) mania bubble?
Does the fact that AI stocks are up 35% this year while the average S&P company is up 7% stick in your craw?
Are you worried that this is just another bubble that is going to suck in unsuspecting investors and end in tears?
A lot of people feel that way, and so do I.
But it’s always and forever a market of stocks, not a stock market.
Don’t worry about other people being stupid or getting hurt.
All it takes to be a stock market genius is to avoid being a stock market idiot.
Do you know who the greatest stock market genius of all time is? Warren Buffett, and as he himself admits, the secret to his success is decades of consistently not being an idiot.
Today BlackRock, Inc. (NYSE:BLK) is one of the best Buffett-style blue-chip buys you can make if you want to be like Buffett and celebrate your non-stupidity. 😉
A World Beater For The Ages
BlackRock was founded in 1988 but has grown into the king of asset management, with 20,000 employees in over 100 countries.
It’s obvious that BLK is an industry titan, but it actually still has a long growth runway ahead of it. The industry has a total of $303 trillion in assets under management (“AUM”), and BlackRock, as the world leader, has just 3% market share.
-
the top 5 asset managers have 10% market share.
Asset management is the ultimate growth industry for one simple reason. It scales infinitely along with the global economy. The richer the world gets, the bigger this industry becomes.
You have to invest your money somewhere, and the rise of passive investing has been a major boon to Blackrock.
Forty million people own iShares ETFs (exchange-traded funds), and 35 million have their retirement accounts invested with BLK courtesy of more than 1,300 ETFs.
BLK’s average expense ratio on ETFs is very low, which is why it’s so popular.
-
8 basis points for core ETFs.
-
17 basis points for factor ETFs.
-
31 basis points for specialty ETFs.
BLK isn’t making a lot off any single investor; it’s generating almost $6 billion in ETF revenue, which is growing at 8% annually. How impressive is that? iShares organic sales growth over the last three years was more than its 3 nearest rivals combined.
In 2022 alone, BLK launched 85 more ETFs so that it could tailor its services to every investing style and need.
BLK is also diversifying into private equity, where it invested over $50 billion in the last two years.
It serves over 400 insurance companies and has more than 130,000 corporate clients using its advanced Aladdin information analysis platform.
-
Aladdin monitors 3,000 risk factors for managing portfolios.
BlackRock’s low-cost funds have saved iShares investors $600 million since 2015.
But BLK is also going after higher-margin businesses like private equity. In fact, it has 195 private equity investment professionals scouring the world for investment opportunities for the $46 billion in committed capital it already has.
BLK’s total private markets business is $156 billion in assets, and it has its finger in almost every pie in the industry:
-
infrastructure.
-
private equity.
-
real estate.
-
private credit.
-
alternatives.
If you like Brookfield (BAM), well, BLK offers some of that kind of growth opportunity while dominating passive, which will always be the #1 form of wealth invested in the world.
How fast is BLK’s private markets business growing? 16% annually since 2018 in terms of assets, while due to higher fees, revenue grew 26%.
And we’re not talking about some token revenue, either. BLK’s private market revenue in 2022 was over $1 billion.
In a world where asset management is growing assets by 4% per year, private markets are growing three times faster.
-
real estate 8%.
-
private equity 10%.
-
private credit 11%.
-
infrastructure 13%.
Remember how Brookfield estimates green infrastructure alone could be a $150 trillion investment opportunity by 2050? BlackRock thinks it will be $3.75 trillion annually for the next 27 years.
And BLK is going to get a piece of that gold rush.
BLK’s energy transition business is “just” $117 billion in AUM and growing like a weed.
BlackRock is so much more than iShares you own in a 401K. Its clients include:
-
state pensions.
-
corporate pensions.
-
insurance companies.
-
endowments.
-
other asset managers (Aladdin).
-
family offices.
-
private banks.
BlackRock has been growing its organic assets by 4.4% annually over the last decade, and Morningstar thinks it can keep growing organically by 4% annually.
Aladdin has grown into a one-stop risk management shop for clients, with 98% retention rates and 12% annual growth over the last three years and 15% annually over the last five.
Aladdin generated $1.4 billion in revenue in 2022 or 7% of company sales.
BlackRock estimates that Aladdin has an 11% market share in a $13 billion market.
But even if you consider just the core ETF business, there is plenty of room for growth. Management estimates ETF AUM will rise from $10 trillion right now to $15 trillion by 2025 and $25 trillion by 2030.
That’s 150% ETF market growth or 14% annually. How is that possible when it seems everyone already owns ETFs? Actually, around the world, ETFs make up just 2% of fixed income and 7% of equity markets.
This is an industry with a long growth runway, and BlackRock is its king.
In fact, in bond ETFs, which are expected to see assets triple by 2030, BLK is the preferred choice for 90% of asset managers.
Globally BLK has barely scratched the surface of growth opportunities.
Outside of the US, it has just $3.2 trillion in AUM.
Globally the industry is growing organic assets by 4% while BLK is growing 50% faster, or 6%.
BLK is famous for passive but has a $2.5 trillion active management business. 81% of BLK’s funds are beating their benchmarks which might explain why its organic growth rate in active is running circles around its peers.
In Q1 2023, active fund organic AUM rose 12% (not counting the booming stock market).
In 2022, a terrible year for stocks, it grew organic AUM by 5% while the industry shrank by 1%.
In 2021, a great year for stocks, the industry grew 4% organically, while BLK tripled that at 12%.
In good times and bad, BLK remains one of the most trusted names in asset management, and it keeps firing on all cylinders.
In the next five years, BLK has a plan to generate 5% annual organic revenue growth outside of stock market gains.
From 2022 through 2025, analysts expect BLK to experience $1.5 trillion in net organic inflows, which don’t account for AUM growth due to rising markets. Note that the net inflows are expected to continue to rise each year:
-
2022: $307 billion (in a terrible year for stocks).
-
2023: $467 billion.
-
2024: $475 billion.
-
.2025: $546 billion.
BLK has been raising its dividend for 20 years at an impressive 17% annually.
That’s not expected to continue in the future, but the point is that this AA-rated industry legend is a dependable income growth opportunity.
Double-Digit Growth Potential For Decades To Come
Ok, we’ve seen how BLK is the king of passive management, with a strong, active, private market and Aladdin portfolio risk management business.
But what kind of growth in its fundamentals does that translate to?
|
Metric |
2022 Growth |
2023 Growth Consensus (Recession) |
2024 Growth Consensus |
2025 Growth Consensus |
|
Sales |
-12% |
5% |
10% |
10% |
|
Dividend |
18% |
2% |
6% |
9% |
|
Earnings |
-10% |
-1% |
15% |
14% |
|
Cash Flow |
4% |
30% |
14% |
25% |
|
EBITDA |
-20% |
5% |
14% |
7% |
|
EBIT |
-22% |
5% |
14% |
12% |
(Source: FAST Graphs, FactSet)
BLK is expected to see earnings take a modest hit this year, but that’s mostly due to higher worker compensation which began last year.
By 2024, earnings are expected to be growth at 14% to 15%.
OK, but long-term, what does all this mean?
11% long-term growth is about 20% better than what analysts expect from the S&P. It’s about the same as Meta Platforms (META).
But BLK is also a dividend stock.
|
Investment Strategy |
Yield |
LT Consensus Growth |
LT Consensus Total Return Potential |
Long-Term Risk-Adjusted Expected Return |
|
BlackRock |
2.9% |
11.1% |
14.0% |
9.8% |
|
Vanguard Dividend Appreciation ETF |
1.9% |
10.7% |
12.6% |
8.8% |
|
Nasdaq |
0.8% |
11.2% |
12.0% |
8.4% |
|
Schwab US Dividend Equity ETF |
3.6% |
7.6% |
11.2% |
7.8% |
|
REITs |
3.9% |
7.0% |
10.9% |
7.6% |
|
Dividend Champions |
2.6% |
8.1% |
10.7% |
7.5% |
|
Dividend Aristocrats |
1.9% |
8.5% |
10.4% |
7.3% |
|
S&P 500 |
1.7% |
8.5% |
10.2% |
7.1% |
|
60/40 Retirement Portfolio |
2.1% |
5.1% |
7.2% |
5.0% |
(Source: FactSet, Morningstar)
14% long-term return potential is better than the S&P, aristocrats, and even the Nasdaq.
Historical Returns Since 1999
BLK’s historical total returns are a market-smashing 17% to 23% annually since 1999.
The long-term consensus of 14% is certainly lower, but still far better than what the S&P will likely deliver, with twice the very conservative yield.
A Wonderful Company At A Fair Price
|
Metric |
Historical Fair Value Multiples (All-Years) |
2022 |
2023 |
2024 |
2025 |
12-Month Forward Fair Value |
|
5-Year Average Yield |
2.67% |
$731.09 |
$749.06 |
$749.06 |
$871.16 |
|
|
PE |
21.08 |
$745.39 |
$739.28 |
$847.21 |
$965.67 |
|
|
Average |
$738.17 |
$744.14 |
$795.12 |
$915.99 |
$768.65 |
|
|
Current Price |
$690.45 |
|||||
|
Discount To Fair Value |
6.46% |
7.21% |
13.16% |
24.62% |
10.17% |
|
|
Upside To Fair Value (including dividend) |
6.91% |
7.78% |
15.16% |
32.67% |
14.22% |
|
|
2023 EPS |
2024 EPS |
2023 Weighted EPS |
2024 Weighted EPS |
12-Month Forward EPS |
Historical Average Fair Value Forward PE |
Current Forward PE |
|
$35.07 |
$40.19 |
$18.21 |
$19.32 |
$37.53 |
20.5 |
18.4 |
BLK is historically worth about 20.5X earnings and today trades at a 10% discount of 18.4X.
-
14X cash-adjusted earnings.
This is a PEG ratio of 1.26 or Ultra SWAN growth at a reasonable price.
|
Rating |
Margin Of Safety For Very Low-Risk 13/13 Ultra SWAN |
2023 Fair Value Price |
2024 Fair Value Price |
12-Month Forward Fair Value |
|
Potentially Reasonable Buy |
0% |
$744.14 |
$795.12 |
$768.65 |
|
Potentially Good Buy |
5% |
$706.93 |
$755.36 |
$730.21 |
|
Potentially Strong Buy |
15% |
$632.52 |
$675.85 |
$653.35 |
|
Potentially Very Strong Buy |
25% |
$530.20 |
$596.34 |
$576.49 |
|
Potentially Ultra-Value Buy |
35% |
$483.69 |
$516.83 |
$499.62 |
|
Currently |
$690.45 |
7.21% |
13.16% |
10.17% |
|
Upside To Fair Value (Including Dividends) |
10.67% |
18.06% |
14.22% |
Blackrock is a potentially good buy for anyone comfortable with its risk profile.
BlackRock 2025 Consensus Total Return Potential
FAST Graphs, FactSet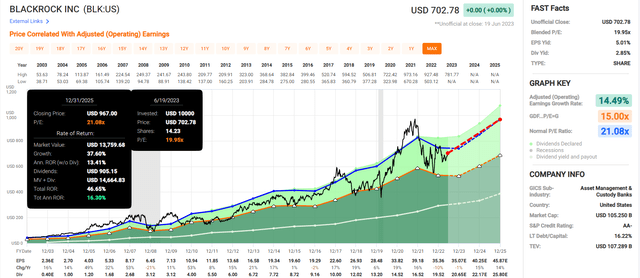
BlackRock 2029 Consensus Total Return Potential
FAST Graphs, FactSet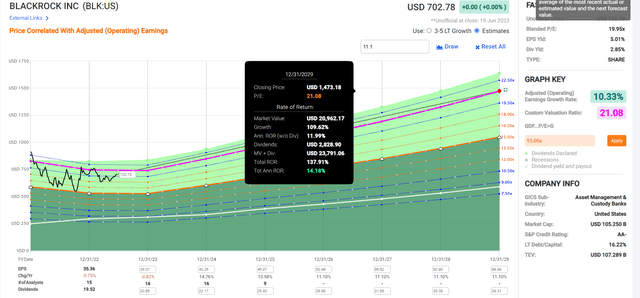
BLK offers an attractive 14% to 16% annual return potential through 2029.
Risk Profile: Why BlackRock Isn’t Right For Everyone
There are no risk-free companies, and no company is right for everyone. You have to be comfortable with the fundamental risk profile.
Risk Profile Summary
Our Uncertainty Rating for BlackRock is High. At this time, we do not consider any of the firm’s environmental, social, or governance issues to be material enough to affect our uncertainty rating or fair value estimate for the firm. BlackRock has staked its future on its ability to manage and market and sell both passive and active investment strategies. With more than 80% of annual revenue derived from management fees levied on its AUM, dramatic market movements or changes in fund flows can significantly impact operating income and cash flows. BlackRock’s investment advisory and administration fees consist primarily of fees that are based on a percentage of the value of managed assets and, in some cases, performance fees expressed as a percentage of the returns realized on AUM.
Movements in equity market prices, interest rates/credit spreads, foreign exchange rates, or all three could cause the value of the firm’s managed assets to decline, which would result in lower investment advisory and administration fees, impacting operating income and cash flows. Shifts among asset classes can be problematic, with fees for actively managed fixed-income and money market funds lower than those for equity and balanced strategies.
Shifts from active to passive strategies can also have an impact, with management fees much lower for index funds and ETFs. That said, we believe that the company is at a lower risk of experiencing material financial impacts from ESG factors due to its medium exposure to risks inherent to the industry and its own operations, offset by the firm’s solid management of its material ESG issues.” – Morningstar
BlackRock’s Risk Profile Includes:
-
market cyclicality risk.
-
M&A risk: BLK makes tuck-in acquisitions to expand its product offerings.
-
labor retention risk (tightest job market in over 54 years).
-
cybersecurity risk: hackers and ransomware.
-
international expansion risk.
-
currency risk.
How do we quantify, monitor, and track such a complex risk profile? By doing what big institutions do.
Long-Term Risk Management Analysis: How Large Institutions Measure Total Risk Management
DK uses S&P Global’s global long-term risk-management ratings for our risk rating.
-
S&P has spent over 20 years perfecting their risk model.
-
which is based on over 30 major risk categories, over 130 subcategories, and 1,000 individual metrics.
-
50% of metrics are industry specific.
-
this risk rating has been included in every credit rating for decades.
The DK risk rating is based on the global percentile of a company’s risk management compared to 8,000 S&P-rated companies covering 90% of the world’s market cap.
BLK Scores 89th Percentile On Global Long-Term Risk Management
S&P’s risk management scores factor in things like:
-
supply chain management.
-
crisis management.
-
cyber-security.
-
privacy protection.
-
efficiency.
-
R&D efficiency.
-
innovation management.
-
labor relations.
-
talent retention.
-
worker training/skills improvement.
-
customer relationship management.
-
climate strategy adaptation.
-
corporate governance.
-
brand management.
BLK’s Long-Term Risk Management Is The 93rd Best In The Master List (82nd Percentile In The Master List)
|
Classification |
S&P LT Risk-Management Global Percentile |
Risk-Management Interpretation |
Risk-Management Rating |
|
BTI, ILMN, SIEGY, SPGI, WM, CI, CSCO, WMB, SAP, CL |
100 |
Exceptional (Top 80 companies in the world) |
Very Low Risk |
|
BlackRock |
89 |
Exceptional |
Very Low Risk |
|
Strong ESG Stocks |
86 |
Exceptional |
Very Low Risk |
|
Foreign Dividend Stocks |
77 |
Good, Bordering On Very Good |
Low Risk |
|
Ultra SWANs |
74 |
Good |
Low Risk |
|
Dividend Aristocrats |
67 |
Above-Average (Bordering On Good) |
Low Risk |
|
Low Volatility Stocks |
65 |
Above-Average |
Low Risk |
|
Master List average |
61 |
Above-Average |
Low Risk |
|
Dividend Kings |
60 |
Above-Average |
Low Risk |
|
Hyper-Growth stocks |
59 |
Average, Bordering On Above-Average |
Medium Risk |
|
Dividend Champions |
55 |
Average |
Medium Risk |
|
MPLX |
47 |
Average |
Medium Risk |
|
Monthly Dividend Stocks |
41 |
Average |
Medium Risk |
(Source: DK Research Terminal)
BLK’s risk-management consensus is in the top 18% of the world’s highest quality companies and similar to that of such other blue-chips as
-
Royal Bank of Canada (RY): Ultra SWAN
-
NVIDIA (NVDA): Ultra SWAN
-
Digital Realty Trust (DLR): Super SWAN
-
Intuit (INTU): Ultra SWAN
-
Northrup Grumman (NOC): Ultra SWAN
The bottom line is that all companies have risks, and BLK is exceptional at managing theirs, according to S&P.
How We Monitor BLK’s Risk Profile
-
20 analysts.
-
three credit rating agencies.
-
23 experts who collectively know this business better than anyone other than management.
“When the facts change, I change my mind. What do you do, sir?”
– John Maynard Keynes.
There are no sacred cows at iREIT® or Dividend Kings. Wherever the fundamentals lead, we always follow. That’s the essence of disciplined financial science, the math behind retiring rich and staying rich in retirement.
Bottom Line: BlackRock: A Buffett-Style Blue-Chip Buy
Dividend Kings Automated Investment Tool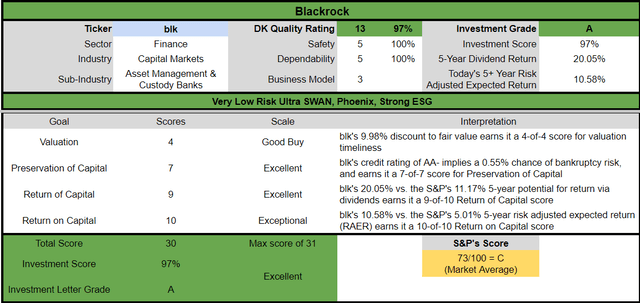
Let me be clear: I’m NOT calling the bottom in BLK (I’m not a market-timer).
Even Ultra SWANs and aristocrats can fall hard and fast in a bear market.
Fundamentals are all that determine safety and quality, and my recommendations.
-
over 30+ years, 97% of stock returns are a function of pure fundamentals, not luck.
-
in the short term; luck is 25X as powerful as fundamentals.
-
in the long term, fundamentals are 33X as powerful as luck.
While I can’t predict the market in the short term, here’s what I can tell you about BLK.
-
global king of asset managers.
-
very conservative 2.9% yield (1% risk of a dividend cut in a severe recession), growing 11-12% long-term.
-
13% to 14% long-term return potential vs. 10.2% S&P.
-
historically 10% undervalued.
-
18.4X earnings vs. 18.5 to 21X historical.
-
138% consensus return potential over the next six years, 14% annually, 3X more than the S&P 500.
-
About 100% better risk-adjusted expected returns than the S&P 500 over the next five years.
-
2X the income potential of the S&P over the next five years.
The market is running on “hopium” and the greater fool theory.
But don’t get angry about the idiots temporarily making more money than you. We all know how this is going to end, in tears and a mountain of broken dreams.
Focus on what you can control, which is buying world-beater blue-chips at good to great prices, just like Buffett does.
BlackRock is one of the best anti-stupid stocks you can buy right now!
This is a company whose moat is strong, getting stronger, and its AA-rated balance sheet gives it the financial firepower to survive everything other than the apocalypse.
As Buffet recommends, buying BlackRock today is a way to celebrate your stock market genius through the disciplined application of common sense.
Author’s note: Brad Thomas is a Wall Street writer, which means he’s not always right with his predictions or recommendations. Since that also applies to his grammar, please excuse any typos you may find. Also, this article is free: Written and distributed only to assist in research while providing a forum for second-level thinking.