DKosig/iStock via Getty Images
“Keep your eye on one thing and one thing only, how much government is spending. Because that’s the true tax. Every budget is balanced. There is no such thing as an unbalanced federal budget. You’re paying for it. If you’re not paying for it in the form of explicit taxes, you’re paying for it indirectly in the form of inBlation or in the form of borrowing. The thing you should keep your eye on is what government spends. And the real problem is to hold down government spending as a fraction of our income. And if you do that, you can stop worrying about the debt.”
Milton Friedman
Review and Outlook

|
3Q |
YTD |
1-Year |
3-Year |
5-Year |
|
|
Wedgewood Composite Net |
-2.4 |
15.9 |
21.9 |
8.6 |
11.1 |
|
Standard & Poor’s 500 Index |
-3.3 |
13.1 |
21.6 |
10.2 |
9.9 |
|
Russell 1000 Growth Index |
-3.1 |
25.0 |
27.7 |
8.0 |
12.4 |
|
Russell 1000 Value Index |
-3.2 |
1.8 |
14.4 |
11.1 |
6.2 |
|
10-Year |
15-Year |
20-Year |
25-Year |
30-Year |
|
|
Wedgewood Composite Net |
10.5 |
12.4 |
10.2 |
10.4 |
12.2 |
|
Standard & Poor’s 500 Index |
11.9 |
11.3 |
9.7 |
7.9 |
9.8 |
|
Russell 1000 Growth Index |
14.5 |
13.7 |
11.1 |
8.3 |
10.2 |
|
Russell 1000 Value Index |
8.5 |
8.6 |
8.2 |
7.4 |
9.0 |
Top performance contributors for the quarter include Alphabet (GOOG, GOOGL), CDW, Booking Holdings (BKNG), Texas Pacific Land (TPL) and META Platforms. Top performance detractors for the quarter include Edwards Lifesciences (EW), Apple (AAPL), Taiwan Semiconductor Manufacturing (TSM), PayPal (PYPL) and Motorola Solutions (MSI).
During the quarter we trimmed Old Dominion Freight Line (ODFL) and purchased O’Reilly Automotive (ORLY).
|
Q3 Top Contributors |
Avg. Wgt. |
Contribution to Return |
|
|
Alphabet |
8.16 |
0.73 |
|
|
CDW |
5.86 |
0.54 |
|
|
Booking Holdings |
4.36 |
0.52 |
|
|
Texas PaciDic Land |
1.69 |
0.50 |
|
|
Meta Platforms |
9.82 |
0.47 |
|
|
Q3 Bottom Contributors |
|||
|
Edwards Lifesciences |
3.76 |
-1.12 |
|
|
Apple |
7.87 |
-0.93 |
|
|
Taiwan Semiconductor Manufacturing |
6.08 |
-0.81 |
|
|
PayPal |
5.34 |
-0.59 |
|
|
Motorola Solutions |
6.92 |
-0.48[1] |
|
Alphabet was a top contributor to performance as search revenues accelerated during their second quarter. This improved performance flies in the face of fears that demand for the Company’s advertising inventory and core search functionality would be diluted by the Company’s own generative-AI offerings and outside substitutes. Alphabet subsidiaries have been at the vanguard of artificial intelligence for more than a decade. The Company has spent almost $150 billion on research and development over just the past five years, and today over 80% of the Company’s advertising customers use an AI-enabled tool when they run their Google Search and YouTube campaigns. Thus, Alphabet is certainly not “behind the curve” in any way, shape, or form when it comes to AI. Quite the contrary, the Company has ample room to rationalize spending to drive better returns on investments and increase capital returns to shareholders at these relatively attractive forward earnings multiples.
CDW also contributed to the performance during the quarter as the Company’s gross profit dollars grew slightly on a very difficult comparison (+35%) from a year ago. Much of this growth was driven by robust demand for software-as-a-services solution that more than offset double-digit declines in hardware from post-pandemic digestion. Software vendors partner with CDW because the Company has relationships with over 250,000 small and medium- sized customers (SMBs). It is often cost-prohibitive for software vendors to sell directly to this “long tail” of SMB customers, so CDW provides value for both IT consumers and vendors. The Company is well-positioned to intermediate technology vendors’ cutting-edge solutions and SMB’s growing IT-budgets, regardless of what new technology comes to dominate those budgets.
Booking Holdings also contributed to portfolio performance during the quarter. The Company reported continued healthy travel demand during the quarter that ended in June, with accelerating trends into July. In addition, Booking’s alt-accommodations sub-segment (about 35% of Booking’s total room nights) reported +11% room night growth, in-line with the Company’s largest pure-play alt-accommodations competitor, Airbnb. We estimate Booking’s total alt-accommodation room nights per quarter are approaching parity with Airbnb, yet Booking has a vastly superior GAAP operating margin structure – even as Booking aggressively outspends Airbnb on merchandising and payment functions, as well as paid search marketing efforts. There is still plenty of room for Booking to take wallet share in consumer travel budgets, which are still pent-up from the pandemic, particularly outside the United States.
Texas Pacific Land contributed to the performance during the quarter. Oil and gas production on the Company’s royalty interests vaulted +25% compared to the same period in 2022, whereas water-related and surface revenues surged +40%. Despite this, revenues were down -9% due to the decline in realized oil prices. Although oil and gas prices will always be volatile over the short-term, we expect development activity on its Permian Basin acreage will grow at a solid pace, primarily driven by both domestic and multinational producers looking to maximize returns on increasingly scarce oil and gas capital expenditures. The Company’s holdings span nearly 880,000 acres in West Texas. Most of this land is located in the highly productive Delaware Basin of the Permian Basin.
Meta Platforms was also a top contributor to performance during the quarter. Please see our last three Letters where we comment on Meta Platforms in detail.
In addition. we would like to comment on Old Dominion Freight Line, which contributed to the performance during the quarter as the market discounted higher future growth prospects after one of the Company’s largest competitors ceased operations. In addition, freight volumes continued to methodically recover after very difficult comparisons from a year ago, and pricing (ex-fuel) remained well above headline inflation. Although Old Dominion is rarely found in growth portfolios, it is one of the best growth stories of the past decade, with revenues tripling and operating income up more than six-fold. Much of this has to do with how much more efficiently the Company is operated relative to its competitors, which are saddled with a disproportionate amount of the legacy pension liabilities of the less-than-truckload (LTL) industry. Furthermore, the seemingly perpetual growth in demand for faster retail shipping as well as the declining reliability of competing modes of transportation (i.e., railroad and TL-truckload), continue to drive favorable long-term dynamics for LTL providers. That said, we trimmed positions in Old Dominion during the quarter as the market became too aggressive in its growth assumptions related to market share take after YRC Freight ceased operations.
Edwards Lifesciences was a leading detractor from performance, despite reporting double-digit revenue growth (foreign exchange adjusted) compared to a year ago. This was driven by growth in the Company’s flagship transcatheter aortic valve replacement (TAVR) franchise, which grew +10% (constant currency). This double-digit growth should continue for the foreseeable future as there is a very large, untreated population which suffers from severe aortic stenosis. Completely unrelated to Edwards, many healthcare investors are fixating on the ballooning demand for weight-loss drugs. As a result, investors are assigning lower multiples to most everything in medical technology, and they view weight loss as a “silver bullet” to many healthcare ailments. However, the risks of weight loss drugs are not yet well understood by investors (or patients), and it is too soon to conclude that this class of drugs will have a negative effect on Edwards’ long-term structural heart care franchise.
Apple detracted from absolute performance during the quarter, as consolidated revenues slightly declined and operating income was flat compared to the past few years of pandemic- induced excess growth. Services revenues grew an impressive +12% (currency neutral), as the Company has more than 1 billion paid subscriptions. As we wrote previously, Apple’s App Store ecosystem is a $1-trillion-a-year industry unto-itself, that helps generate astonishingly high returns on capital for the Company. Many growth investors have shunned Apple for years, despite this unparalleled growth, considering it still, just a “hardware company.” However, we do sympathize with that assessment, somewhat, plus the stock’s historically richer valuation, if only evidenced by our weighting in Apple – despite being almost 8% – it is still just three-quarters of the double-digit weighting Apple carries in one of the more popular growth benchmarks.
Taiwan Semiconductor Manufacturing detracted from performance, as revenues declined 10% from a year ago. The Company is lapping revenue growth of over +40% (compared to 2022) during every quarter of 2023, so it is more instructive to look at the health of the business through the lens of a multi-year timeframe. Most of the Company’s customers have seen near-term weakness in demand due to pandemic normalization. However, we think the longer-term trend of more silicon per device is still very much intact, and the Company is well-positioned to serve this, given its commanding market share in leading edge capacity. The Company’s aggressive investment in leading-edge equipment combined with tight development with fabless IC designers, plus the embrace of open development libraries, should continue to foster a superior competitive position and attractive long-term growth.
PayPal was a detractor from performance during the quarter. Total payment volume grew +11% while revenues grew +8% – both FX-neutral. Adjusted operating earnings grew +20%. E-commerce industry sales trends have normalized back to their pre-pandemic trend of growth, with high-margin branded payments keeping track with the industry. Despite this, investors continue to be concerned that PayPal’s fast-growing private-label payments solutions will dilute Company returns. However, payments is a very scalable business, and the Company will be able to manage both private label and branded for attractive returns and double-digit growth. While multiples in the payment industry have significantly compressed, especially after the multi-year process of being added to the index financial sector, PayPal’s businesses are substantially different enough from traditional spread-based businesses; in addition to possessing much more compelling growth drivers, PayPal’s well below market multiple should revert to its higher, historical average.
Motorola Solutions contributed to performance during the quarter. Revenue grew a healthy +12%, while the Company’s adjusted operating profit jumped +29% on better pricing and easing supply chain costs. The Company’s backlog grew +6% as the funding environment for its customers, particularly in public safety, remains strong. We expect Motorola’s core public safety customers to continue adopting and upgrading their LMR (land mobile radio) infrastructure, while expanding into software and service solutions that drive higher productivity in the face of chronic labor shortages.
Company Commentaries
O’Reilly Automotive
The aftermarket auto parts industry is a retailer’s dream. Such dreams include: market share take opportunities for better operators in a fragmented industry, hard-to-replicate, competitively advantaged, distribution network effects, which increasingly get closer to customers; three decades of consistently positive annual sales comps; recession resistance; consistent new store openings; steady growth from multiple avenues; increasing profitability from company branded products; increasing long-lived “customers” (more and better cars on the road, more cars on the road past warranty and more miles driven); and reinvestment of cash back into the business at expanding margins. Net, net, witness O’Reilly’s stellar profitability profile:
Source: FactSet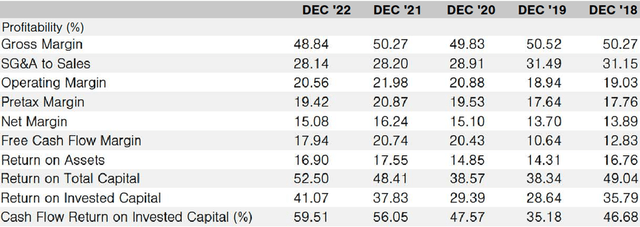
Circa-2023 is delivering an extra gust to these tailwinds in the form of significantly higher financing for both new and used cars. Thus, U.S. automobile owners are literally forced to keep cars longer. As mileage racks up, maintenance and repair bills rack up too.
Source: Bank of America/Merrill Lynch Source: S&P Global Mobility, Axios Visuals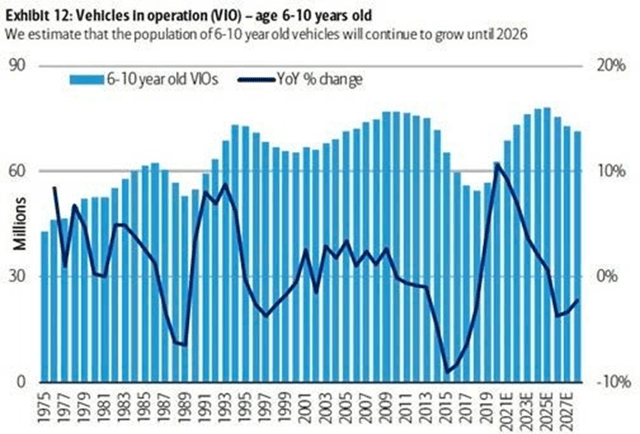
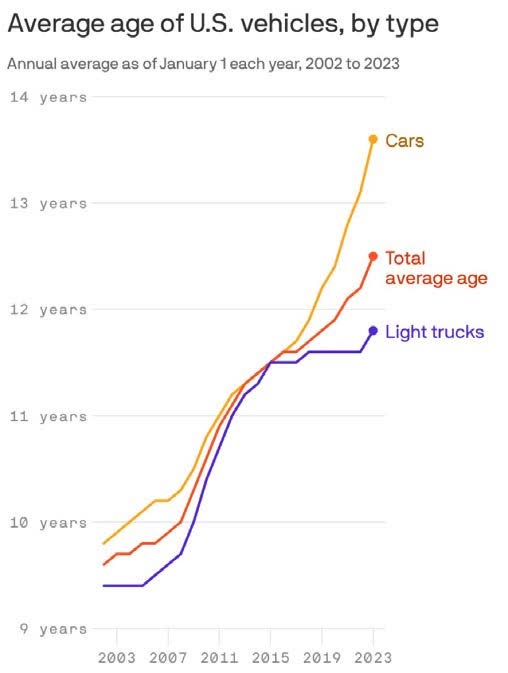
The U.S. Energy Information Administration (EIA) estimates that global fleet of internal combustion engine (ICE) light vehicles will peak in 2038. In addition, the EIA projects that electric vehicles (EVs) will account for +30% of the global fleet by 2050. We take such long dated forecasts with a grain of salt, yet we do not disagree with the expectation that the auto parts industry has a long pathway of growth. The jury is still out on whether the technological advancements of EVs will render these vehicles mainstream in locales where the extremes of the four seasons are present. As of today, the annual maintenance cost of an EV is less than the cost of an ICE vehicle. That said, the undercarriages of EVs (brake calipers, brake pads, rotors, shocks, etc.) need to be repaired at similar intervals as ICE vehicles.
The U.S. auto parts industry has been largely dominated by the four well-known publicly traded companies – Advanced Auto Parts (including Car Quest), AutoZone, NAPA (owned by Genuine Parts Company) and O’Reilly Automotive. Surprisingly, given when these companies were founded, the U.S. auto parts industry remains largely fragmented. Their respective founding’s: Advanced-Carquest: 1932-1974. AutoZone: 1979. NAPA: 1925. O’Reilly: 1957. By far, the leading two companies in terms of profitability and growth are AutoZone and O’Reilly – then O’Reilly over AutoZone over the past few years – by the nose of a bumper.
Before we get into the modern incarnation of O’Reilly Automotive, we would like to share a short history of the Company. The U.S. retail industry is historically rich in Horatio Alger success stories. We all know the antecedent storyline of such histories. Insomniac entrepreneur, usually already well into their years, start with a single tiny store – and a dream. Countless hours, later family, children, and siblings, then succeeding generations share the founder’s dream. Decades of too many hours of work to count. Some success. Then, better success. Then maybe, just maybe, an IPO. Then rarer still, generational wealth. Many know the story of the Waltons from Columbia, Missouri. Few know of the O’Reilly family from Springfield, Missouri. Fewer still, of George Pepperdine, who, in 1909 founded the Western Auto Supply Company in Kansas City, Missouri. Pepperdine would later found his namesake university in the hills of Malibu, California in 1937. Last, but not least, there is also the Morris family of Bass Pro Shops/Cabela’s fame from Springfield, Missouri, too – (something in that Ozark water…)
The Company estimates there are +37,000 auto parts locations in the U.S. The top-10 auto parts chains capture about 54% of these stores – up slightly from 48% back in 2012. AutoZone, O’Reilly and Advanced Auto dominate the industry with over 17,000 locations between them. The Company currently operates just over 6,000 stores in 48 states and Puerto Rico and 44 stores in Mexico. The Company opens between 175 and 185 new stores each year, most often in clusters, supported by a distribution center.
The U.S. auto parts industry is really two separate industries. The one we are most familiar with is do-it-yourself (DIY). The retail landscape has long been dotted by the ubiquitous stand-alone retail stores of the major public operators. For those living in small towns, one has surely been puzzled by the fact that three or four auto parts stores can survive, much less thrive in even the smallest of towns.
The other part of the industry is do-it-for-me (DIFM) – the most fragmented, and the larger driver of growth versus DIY. We are all too familiar with the situation where, when we take our car into the local auto repair shop for, say, a new set of tires, and the mechanic informs us that our brakes, shocks, etc. need to be replaced as well. That is when the differential elements of DIFM kick in. Every auto repair shop carries very little inventory on-site. Every repair shop, therefore, needs to call out to local auto parts companies, either public or private for the specific repair/maintenance needs for each car in each bay. Time is of the essence. Time is money. The parts manager must source parts as quickly as possible. Calls go out to the auto parts companies. Everything else being reasonably equal in quality and price, the auto parts company that can get parts to the repair shop the fastest gets the order. Fast, meaning no more than 30 minutes or so. Idle mechanics are a huge cost. Over time, these repair shop call lists are the bread and butter of the DIFM parts companies. Not only do you need to be on that call list, but if you perform well, you are then at or near the top of the ocean-front property call list. As such, DIFM customers can be a fountain of recurring revenues and profitability. They are for O’Reilly at least.
Amazon and Walmart are not significant competitors in the DIFM market. Their collective competition in the DIY is not a key factor either. Even the most die-hard DIYer need both local stores and informed advice – a key differentiation that both Walmart and Amazon struggle to match.
O’Reilly began its dual market strategy between DIY and DIFM back in 1978. Today, the split is about 60% DIY and 40% DIFM, with 6,027 stores in 48 states, 28 distribution centers, plus a small presence in Mexico (44 stores).
In order to thrive in the DIFM market – and O’Reilly is arguably the best public DIFM operator – an auto parts company must build and operate a capital-intensive, strategically dense distribution system of countless parts as close as possible to repair shops. O’Reilly operates a hub-and-spoke system, which includes 28 distribution centers, +275 “hub” stores, +90 “superhub” stores, and thousands of regular stores. The daily choreography between distribution centers, hub stores and smaller retail stores is as intense as one might assume. O’Reilly’s hub stores carry between 43,000 and 71,000 SKUs – smaller stores “just” 20,000 SKUs. Hub stores deliver parts to smaller stores multiple times every day and into the evening as well.
The DIY market is characterized by those with lower incomes with a single, even older model car. Such customers tend to attempt to maintain or fix simpler repairs on their own. DIY customers also tend to be more price sensitive than the time sensitive, demanding DIFM customers.
Many companies – too many, really – talk about “culture.” Rare is the company that can match O’Reilly’s culture. O’Reilly hires young. Dispenses significant responsibility at the store manager level. Promotes from within.
Management Team Present Today
Years of Experience in the Automotive Aftermarket Industry
|
Greg Johnson |
President & Chief Executive Officer |
40 Years |
|
Brad Beckham |
Chief Operating Officer & Executive Vice President |
26 Years |
|
Brent Kirby |
Chief Supply Chain Officer & Executive Vice President |
4 Years |
|
Jeremy Fletcher |
Chief Financial Officer & Executive Vice President |
16 Years |
|
Doug Bragg |
Executive Vice President of Operations and Sales |
31 Years |
|
Tom McFall |
Executive Vice President |
24 Years |
|
Robert Dumas |
Senior Vice President of Eastern Store Ops & Sales |
30 Years |
|
Mark Merz |
Senior Vice President of Finance |
15 Years |
|
Jimbo Dickens |
Vice President of Gulf States Division |
29 Years |
|
Ernie Golden Jr |
Regional Director – Stores |
20 Years |
|
Thad Slicker |
Regional Director – DCs |
14 Years |
|
Charles Dwyer |
Distribution Center Manager |
10 Years |
|
Eric Bird |
Director of Financial Planning and Treasury |
6 Years |
|
Source: Company Analyst Day 2022 |
In July this year, the Company announced the near-term retirement of CEO Johnson, with his replacement of Beckham. In addition, Kirby moves to president. We expect these moves to be seamless.
The Company boasts that those employees with experience with at least one store EVP and three store SVP collectively amount to over 90 years. Those dozen-plus division VPs with industry experience collectively amount to over 300 years. This “family” culture has resulted in a very deep bench of multi-decade management ranks – yet was long planted by the O’Reilly family themselves. The Company’s culture-harvest has been bountiful.
O’Reilly also incentivizes management with cash bonuses not based on growth, but profitability – specifically return on invested capital. We hope management hears our loud applause.
O’Reilly’s dreams have manifested themselves into the reality of leading industry profitability – as well as leading profitability in all of retailing. The virtuous reinvestment of copious free cash flow back into the business at ever-expanding margins has enriched shareholders, all the while expanding the Companies size, scope and scale, furthering O’Reilly’s competitive advantages.
The Company’s consistently positive revenue growth over its dense network has resulted in consistent operating leverage. Since 2007, the Company’s operating margin has grown from 12% to 22%, its profit margin from 5% to 15% and its cash flow return on invested capital from 13% to 25%. In addition, the Company calculates its return on invested capital grew from around 11% in 2008 to 39% in 2019. During the pandemic, the Company thrived. Return on invested capital soared to 49%, 68% and 72%, in 2020, 2021, and 2022, respectively.
In the years ahead, we expect O’Reilly to continue to gain market share, grow its store count, comp sales at mid-single digits, and grow earnings at high single digits to low double digits. Growth by acquisition is quite limited these days. The Company’s earlier history was dominated by a number of expansive acquisitions building out a national footprint, including Hi/LO Automotive (1998), Mid-State (2001), Midwest Automotive Distributors, CSK Auto (2008), VIP Auto Parts (2012), Bond Auto Parts (2016), Bennett Auto Supply (2018) and Mexico-based Mayasa Auto Parts (2019).
O’Reilly’s nationwide footprint is still lacking a large presence in the Northeast, as well as the Atlantic coast. The Company noted that, as of late 2021, it typically operates a store in their network for every 56,000 people in the U.S. However, in the Northeast, it operates a single store for every 189,000 people. M&A opportunities may still exist to fill this gap. If not, organic growth to fill out this gap may take years to fill.
We applaud the Company’s long-held capital allocation discipline: reinvest into more ever profitable stores, pay zero cash dividends, and continue to hoover up the shares. We have long advocated for share buybacks to be executed at least at reasonable valuations, and with a fat bat when such pitches are fat themselves. Indeed, the Company has cut its share count in half just since 2013.
(Post-script: Some of the more aged investment team members at Wedgewood are selfproclaimed “gearheads.” Furthermore, we ardently proclaim the movie Smokey and the Bandit to be one of the best documentaries ever produced by Hollywood! We (ok, I) have watched the amazing O’Reilly growth story (AutoZone, too) unfold for too many years. We are delighted to finally be investors in O’Reilly.)
Fed Up
The high-stakes poker game called “Fed watching” has took an unexpected turn in midSeptember. After crashing California regional banks through the windshield back in March, the current yield curve dynamic may be even worse. The latest card Powell & Co. played calls for “higher interest rates for longer.” The bad beat by consensus Wall Street is not pleased. Earlier in the year, they assumed their collective A-game would be Fed rate cuts this fall. The Fed, however, not Wall Street, is in the zone. Powell’s new ante is no rate cuts before 2025.
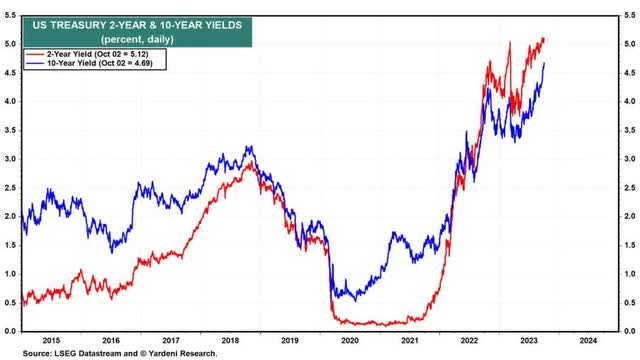
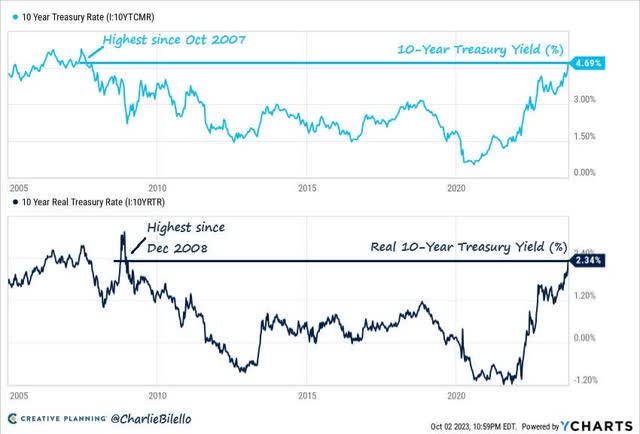
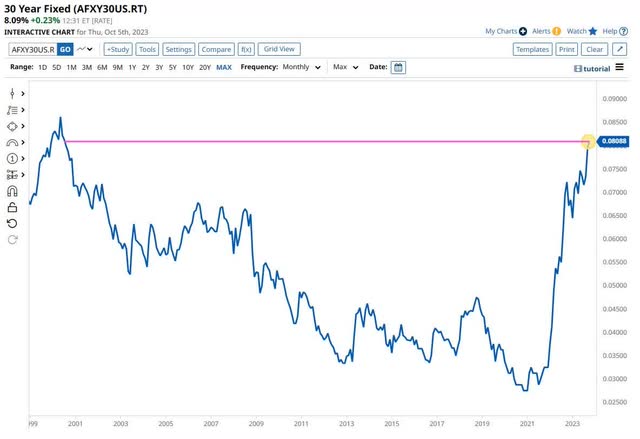
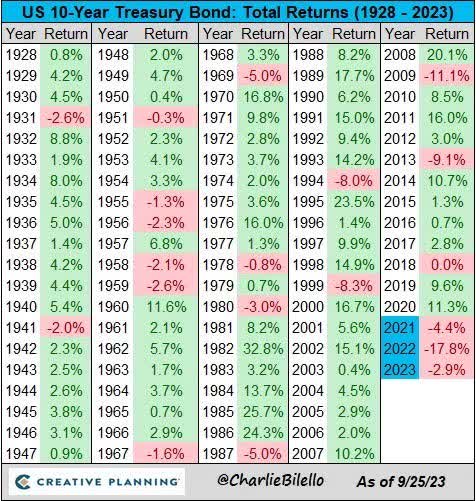
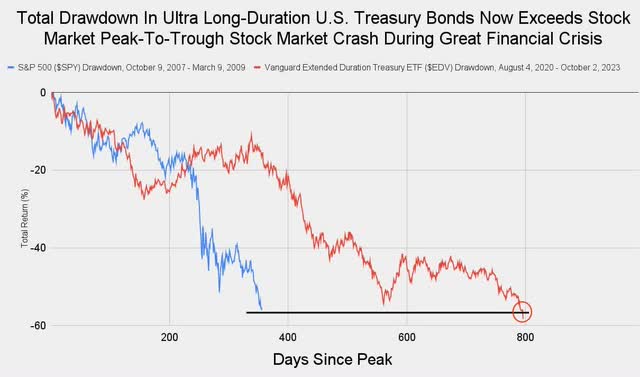
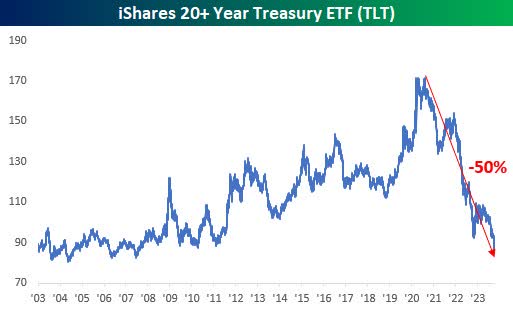
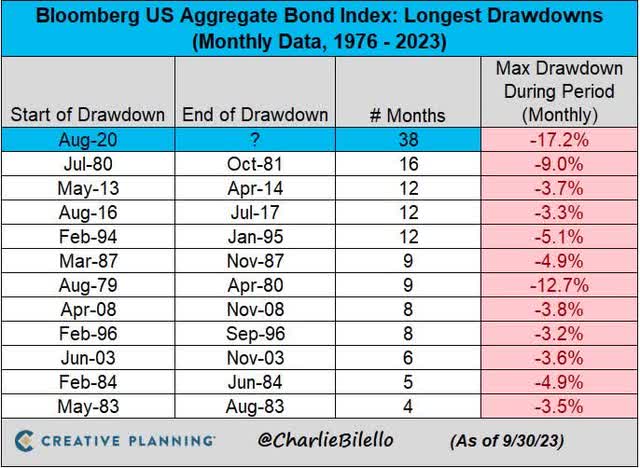
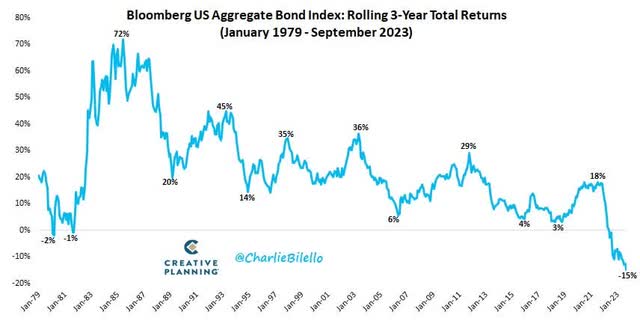
The surge in Treasury yields is unprecedented. Shorter term Treasury yields are the highest since late 2000/early 2001. Two-year yields are the highest since 2006. All other yields are back to 2007 levels. The 10-year Treasury is set to post a negative total return this year for the third year in a row – again, unprecedented. Also, 30-year mortgage rates have cracked 8% – the highest in 23 years. Bonds are in a bear market of historic proportions. The Bloomberg U.S. Aggregate Bond Index has suffered a 38-month drawdown, declining -17% – both measures new records, by far.
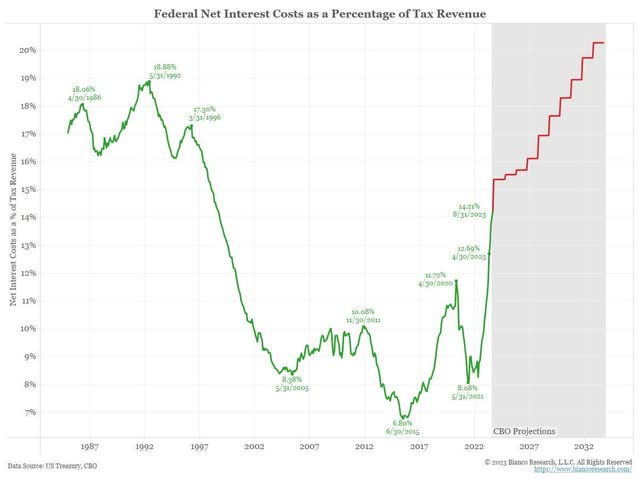
Powell & Co., once of the “inflation is transitory” infamy, are trying to kick inflation in the teeth, all the while kicking the U.S. bond market and U.S. financial system in the teeth in the process. In addition, our exploding budget deficit (+$ 2 trillion, and counting) is kicking in the teeth of our U.S. Treasury in their attempt to finance said trillion-dollar deficits. Who is going to buy the avalanche of paper to be issued? Relatedly, how bad will the debt spiral be as interest expense on the nation’s debt consumes an ever-higher percentage of the federal budget?
What will Powell & Co. break next?
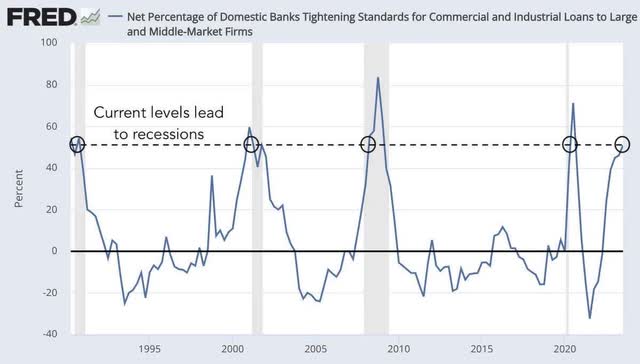
Please note in the following graphics and charts the ongoing carnage:
Source: Zero Hedge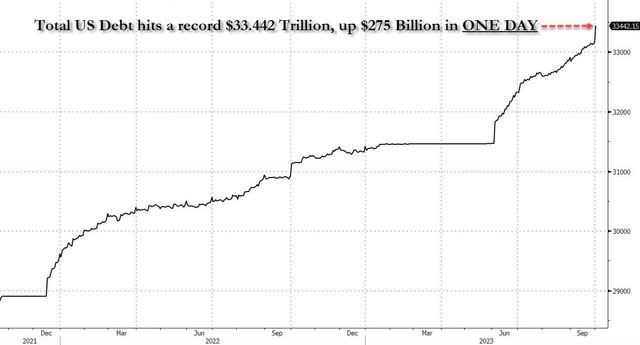
Source: Zero Hedge
Source: Jack Farley Source: Bespoke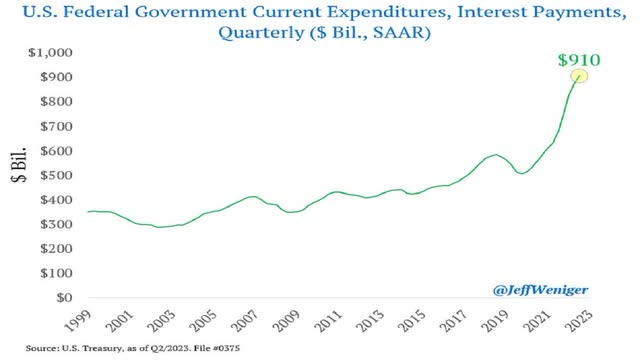
|
David A. Rolfe, CFA |
Michael X. Quigley, CFA |
Christopher T. Jersan, CFA |
|
Chief Investment Of@icer |
Senior Portfolio Manager |
Portfolio Manager |
Footnotes[1] Portfolio contribution calculated gross of fees. The holdings identified do not represent all the securities purchased, sold, or recommended. Returns are presented net of fees and include the reinvestment of all income. “Net (actual)” returns are calculated using actual management fees and are reduced by all fees and transaction costs incurred. Past performance does not guarantee future results. Additional calculation information is available upon request. Disclosure: The information and statistical data contained herein have been obtained from sources, which we believe to be reliable, but in no way are warranted by us to accuracy or completeness. We do not undertake to advise you as to any change in Iigures or our views. This is not a solicitation of any order to buy or sell. We, our afIiliates and any ofIicer, director or stockholder or any member of their families, may have a position in and may from time to time purchase or sell any of the above mentioned or related securities. Past results are no guarantee of future results. This report includes candid statements and observations regarding investment strategies, individual securities, and economic and market conditions; however, there is no guarantee that these statements, opinions or forecasts will prove to be correct. These comments may also include the expression of opinions that are speculative in nature and should not be relied on as statements of fact. Wedgewood Partners is committed to communicating with our investment partners as candidly as possible because we believe our investors beneIit from understanding our investment philosophy, investment process, stock selection methodology and investor temperament. Our views and opinions include “forward-looking statements” which may or may not be accurate over the long term. Forward-looking statements can be identiIied by words like “believe,” “think,” “expect,” “anticipate,” or similar expressions. You should not place undue reliance on forward-looking statements, which are current as of the date of this report. We disclaim any obligation to update or alter any forward-looking statements, whether as a result of new information, future events or otherwise. While we believe we have a reasonable basis for our appraisals and we have conIidence in our opinions, actual results may differ materially from those we anticipate. The information provided in this material should not be considered a recommendation to buy, sell or hold any particular security. |
Original Post
Editor’s Note: The summary bullets for this article were chosen by Seeking Alpha editors.
Editor’s Note: This article discusses one or more securities that do not trade on a major U.S. exchange. Please be aware of the risks associated with these stocks.


