Lee Walters
Last week, it was an oversight to not post the S&P 500 valuation data and relative metrics. Has to be the first time that’s been overlooked in years.
S&P 500 data:
- The forward 4-quarter estimate (FFQE) fell this week to $222.36 from last week’s $222.43.
- The P/E multiple on the forward estimate is 18.3x versus the 17.2x to end 2022.
- The S&P 500 earnings yield was 5.45% this week, versus 5.44% last week and 5.81% to end 2022.
The Q4 ’22 earnings season ends next week (unofficially speaking) with Walmart (WMT) reporting their holiday quarter or rather their 4th fiscal quarter of the 2023 fiscal year. If Walmart can continue to improve their inventory issue, it would go a long way to helping the stock (in my opinion). Most people don’t realize that Walmart is the largest grocer in the world. Half of their $600 billion in annual revenue is grocery revenue, and while Amazon (AMZN) wants to make inroads in this market, everyone else is a distant 2nd. Some analysts have put Walmart’s grocery percentage as high as 70% of total revenue. That stat has only been heard from one analyst though. (An earnings preview will be posted to www.seekingalpha.com.)

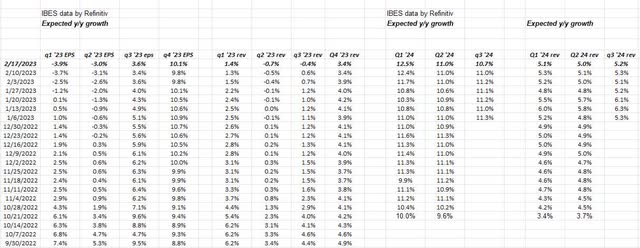
Readers should expand this spreadsheet and look at the bottom-up data for S&P 500 EPS and revenue for each of the 4 quarters of 2023.
It’s pretty grim for the first 2 quarters of 2023, and while there was some hope for Q3 ’23 in late 2022, Q3 ’23 EPS estimates have seen negative revisions.
Only Q4 ’23 seems to have withstood the steady and inexorable slide we’ve seen in numbers the last 9 months.
2024 does look solid though, but it’s still too early to say or make a reasonable decision about those estimates.
Note 2023 revenue by quarter – it looks like 2023 could see flat revenue for the S&P 500.
Summary / conclusion:
Q4 ’22 earnings season will end this week, and for the last 6 weeks of the quarter we’ll start to see companies report with quarters ending January and February ’23. It’s clear that there is little reason for sell-side analysts to stick their neck and raise estimates, in this environment.
And yet the bizarre thing is that – despite expected flat revenue for the S&P 500 in 2023 and currently barely positive S&P 500 EPS growth – the S&P 500’s YTD return as of Thursday night’s, February 16, 2023, close was +6.76%.
There is nothing all that riveting or interesting about S&P 500 earnings data.
Something will have to give at some point: either the S&P 500 will break down or, if the S&P 500 continues to rally, eventually earnings estimates for 2023 will confirm the rally.
Seriously, the only data improvement this week was that the expected S&P 500 2023 EPS estimate rose $0.01 sequentially this week from $222.84 last week to $222.85 this week , which was the first sequential improvement in 11 weeks (and only the second sequential improvement since June 24th) and the expected 2024 S&P 500 EPS estimate rose $0.02 to $249.42 from $249.40.
Talk about grim.
Take all this data and commentary with a healthy dose of skepticism. The S&P 500 earnings data is courtesy of IBES data by Refinitiv, but the tracking and spreadsheets and calculations and mistakes are all this blog’s. Capital markets can change quickly – both for better and worse. The technicians remain pretty bullish on the stock market, while – as evidenced by this blog’s S&P 500 earnings work – the fundamentalists are less optimistic than technicians. Take everything with a grain of salt. Past performance is no guarantee of future results.
Thanks for reading.
Original Post
Editor’s Note: The summary bullets for this article were chosen by Seeking Alpha editors.


