ThitareeSarmkasat
The market has priced in the much-anticipated pause in the Fed tightening cycle, which many hope will give the green light to equities.
Fed funds futures predict a 90% chance that the Fed keeps rates at 5% to 5.25% at the June meeting and more than a 70% chance that cuts begin in September.
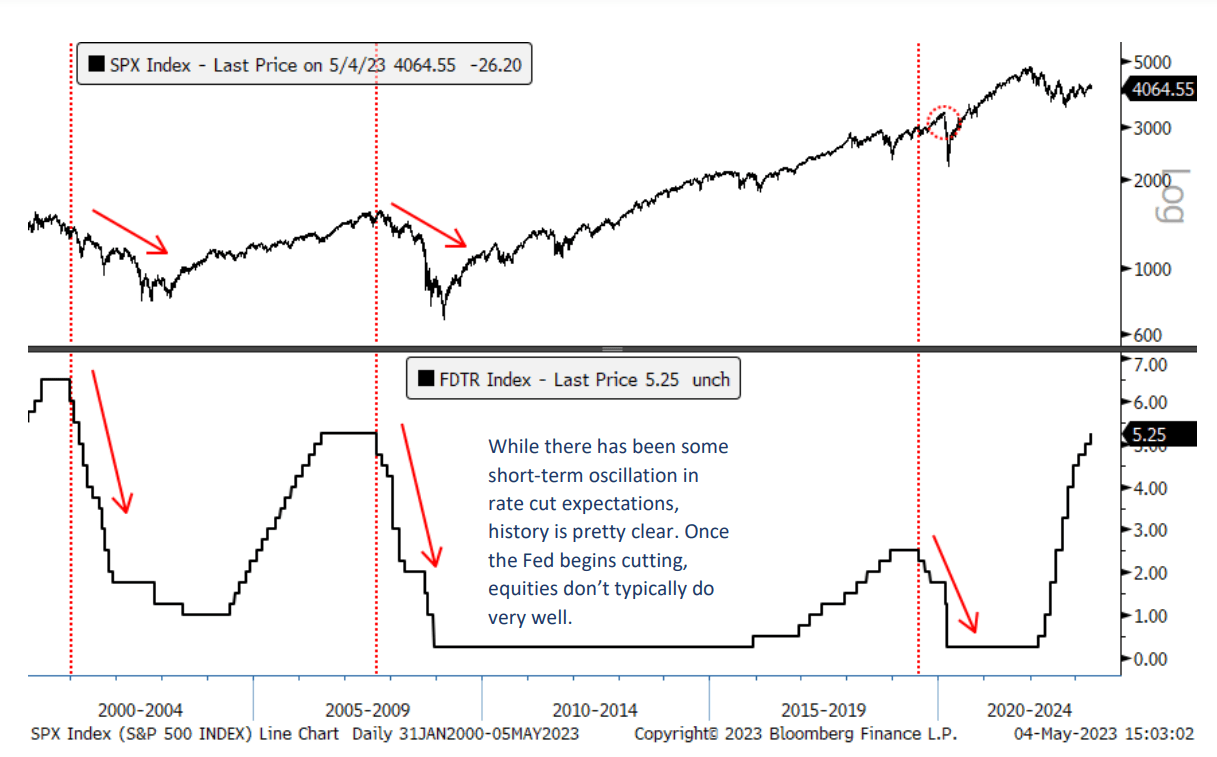
But rates cuts aren’t really bullish for stocks, based on history, Jonathan Krinsky, technical strategist at BTIG, said.
“While there has been some short-term oscillation in rate cut expectations, history is pretty clear,” Krinsky wrote in a note. “Once the Fed begins cutting, equities don’t typically do very well.”

Worst stock market breadth in 20 years
“Since 1990, there have been 29 streaks where the SPX (SP500) (NYSEARCA:SPY) (IVV) (VOO) went at least 34 days above its 200 DMA,” Krinsky said. “The avg. percentage of components above the 200 DMA is 69%. It’s currently at 47%.”
“This is the third weakest reading, as only Dec. ’98 and Dec. ’99 were there less stocks above the 200 DMA than there are currently at the 34-day mark. The other weakest readings were July ’00, Sep. ’00, Oct. ’07, and July ’12. So, of the six weakest readings, four (’99, ’00, ’07) were at or near market peaks while two (’98 and ’12) were still in strong bull markets.”
“As we discussed last week, the market cap performance since the Oct lows is completely opposite what we typically see in new bulls,” he added. “Our view remains what this is not a new bull market, and this breadth divergence should get resolved with the indices moving lower as opposed to breadth moving higher.”
Look beyond the U.S. for gains?
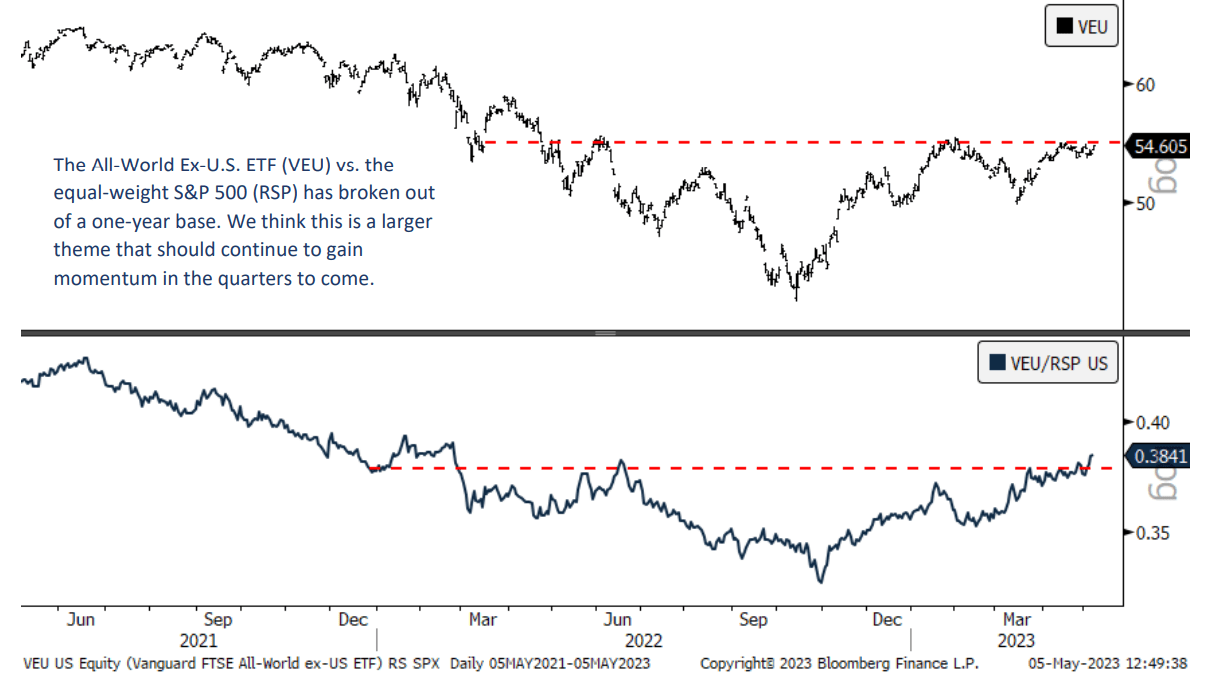
“The All-World Ex-U.S. ETF (VEU) vs. the equal-weight S&P 500 (RSP) has broken out of a one-year base,” Krinsky said. “We think this is a larger theme that should continue to gain momentum in the quarters to come. European (IEV) (VGK) breadth also much more robust than U.S. Mexico (EWW) remains strong, China (FXI) is coiled, and Japan (EWJ) working through a base.”


