The answer to the question “Is performance good?” requires an answer to another question: ”Relative to what?” Target date fund performance provides a good benchmark for multi-asset portfolios because they can be broken out by risk and investment horizon, as shown in the following graph:
2020 funds for people retiring between 2015 and 2025 have returned between 2% and 4% depending on the underlying risk. By contrast, long-dated 2060 funds have returned between 6.5% and 8% — higher returns for higher risk, namely more stocks.
The “Industry” in the graph is the S&P target date index of all TDF mutual funds. The risk-based results are for the OPEIU NRSP—Office Professional Employees International Union National Retirement Savings Plan. OPEIU’s long-dated funds have lagged due to diversification, namely into real estate.
How have you performed so far this year? How does it compare to TDF performance?
Regardless of your relative performance, are you concerned about inflation and how that is affecting the stock market? Stocks are going up despite inflation fears. Now is a good time to reflect on what happened to the stock market in Venezuela when inflation reared its ugly head: Venezuela’s stock market skyrocketed.
Venezuela: Riches to Rags
Venezuela once was one of the richest countries due to its oil reserves, believed to be the largest in the world. The economy of Venezuela rose and fell with the price of oil, so the economy struggled when oil prices began dropping in the 1980s. But growth was restored, and the economy leveled out, leaving poverty in its wake. Consequently, Venezuelans were unhappy with capitalism in the 1990s, so they elected Hugo Chavez as president in 1998, who launched the Bolivarian Revolution, which performed “missions” and social programs for the country. And it succeeded in lifting people out of poverty. Socialism “worked” at first but ultimately led to money printing.
Chavez’s missions had a dark underbelly. In the years that followed his election, Chávez seized individual wealth, including land and companies, put his supporters in positions of power and gave the military broad control. Unfortunately, control of the oil industry was in incompetent hands that did not plan for cyclicality in oil prices. Consequently, money printing outstripped oil revenues through time bringing the debt-to-GDP ratio above 240% in 2010.
In 2010, ahead of an upcoming election and as the global price of oil fell, Chávez announced he was decreasing the value of the bolivar, the nation’s currency, in order to monetize the debt. The bolivar was worth more than the U.S. dollar but dropped after Chávez’s decision, then continued to plummet. Hyperinflation of 130,000% ensued in 2018 and remains near 400% today.
Along the way, Venezuela’s stock market taught a lesson in 2016 when the Venezuelan stock market performed best in the world, earning 114% versus 13% on the Dow. This event has direct application to the recent US stock market. According to this Marion West article:
The curious case of the Venezuelan public equities market is a prime example of why it can be misleading to use stock markets as indicators of economic performance. Most economists agree that Venezuela’s economy is in turmoil, and that there is no end in sight. The real reason behind the market’s astronomical rise has little to do with ebullient investor sentiment, but instead is one of the symptoms of the government’s inflationary monetary policy. In short, owners of the country’s currency protected themselves from the currency’s severe devaluation by exchanging their bolivars for seemingly safer assets, including stocks. With huge volumes of money pouring in, the stock market artificially inflated.
The wealth divide problem was solved. Venezuela’s billionaires are penniless today. A stock market rally in 2016 demonstrates how an economic calamity can distort stock prices upward while values are actually falling. US investors shouldn’t be fooled by a soaring stock market in the face of a pandemic and roaring inflation. Politicians shouldn’t take credit for an illusion; it’s actually laughable.
There are several lessons that can be learned:
- The great wealth divide in the US needs to be addressed carefully. Socialism is probably not the best answer. Money printing could solve the problem by reducing the wealth of the rich through hyperinflation, an ultimate wealth tax.
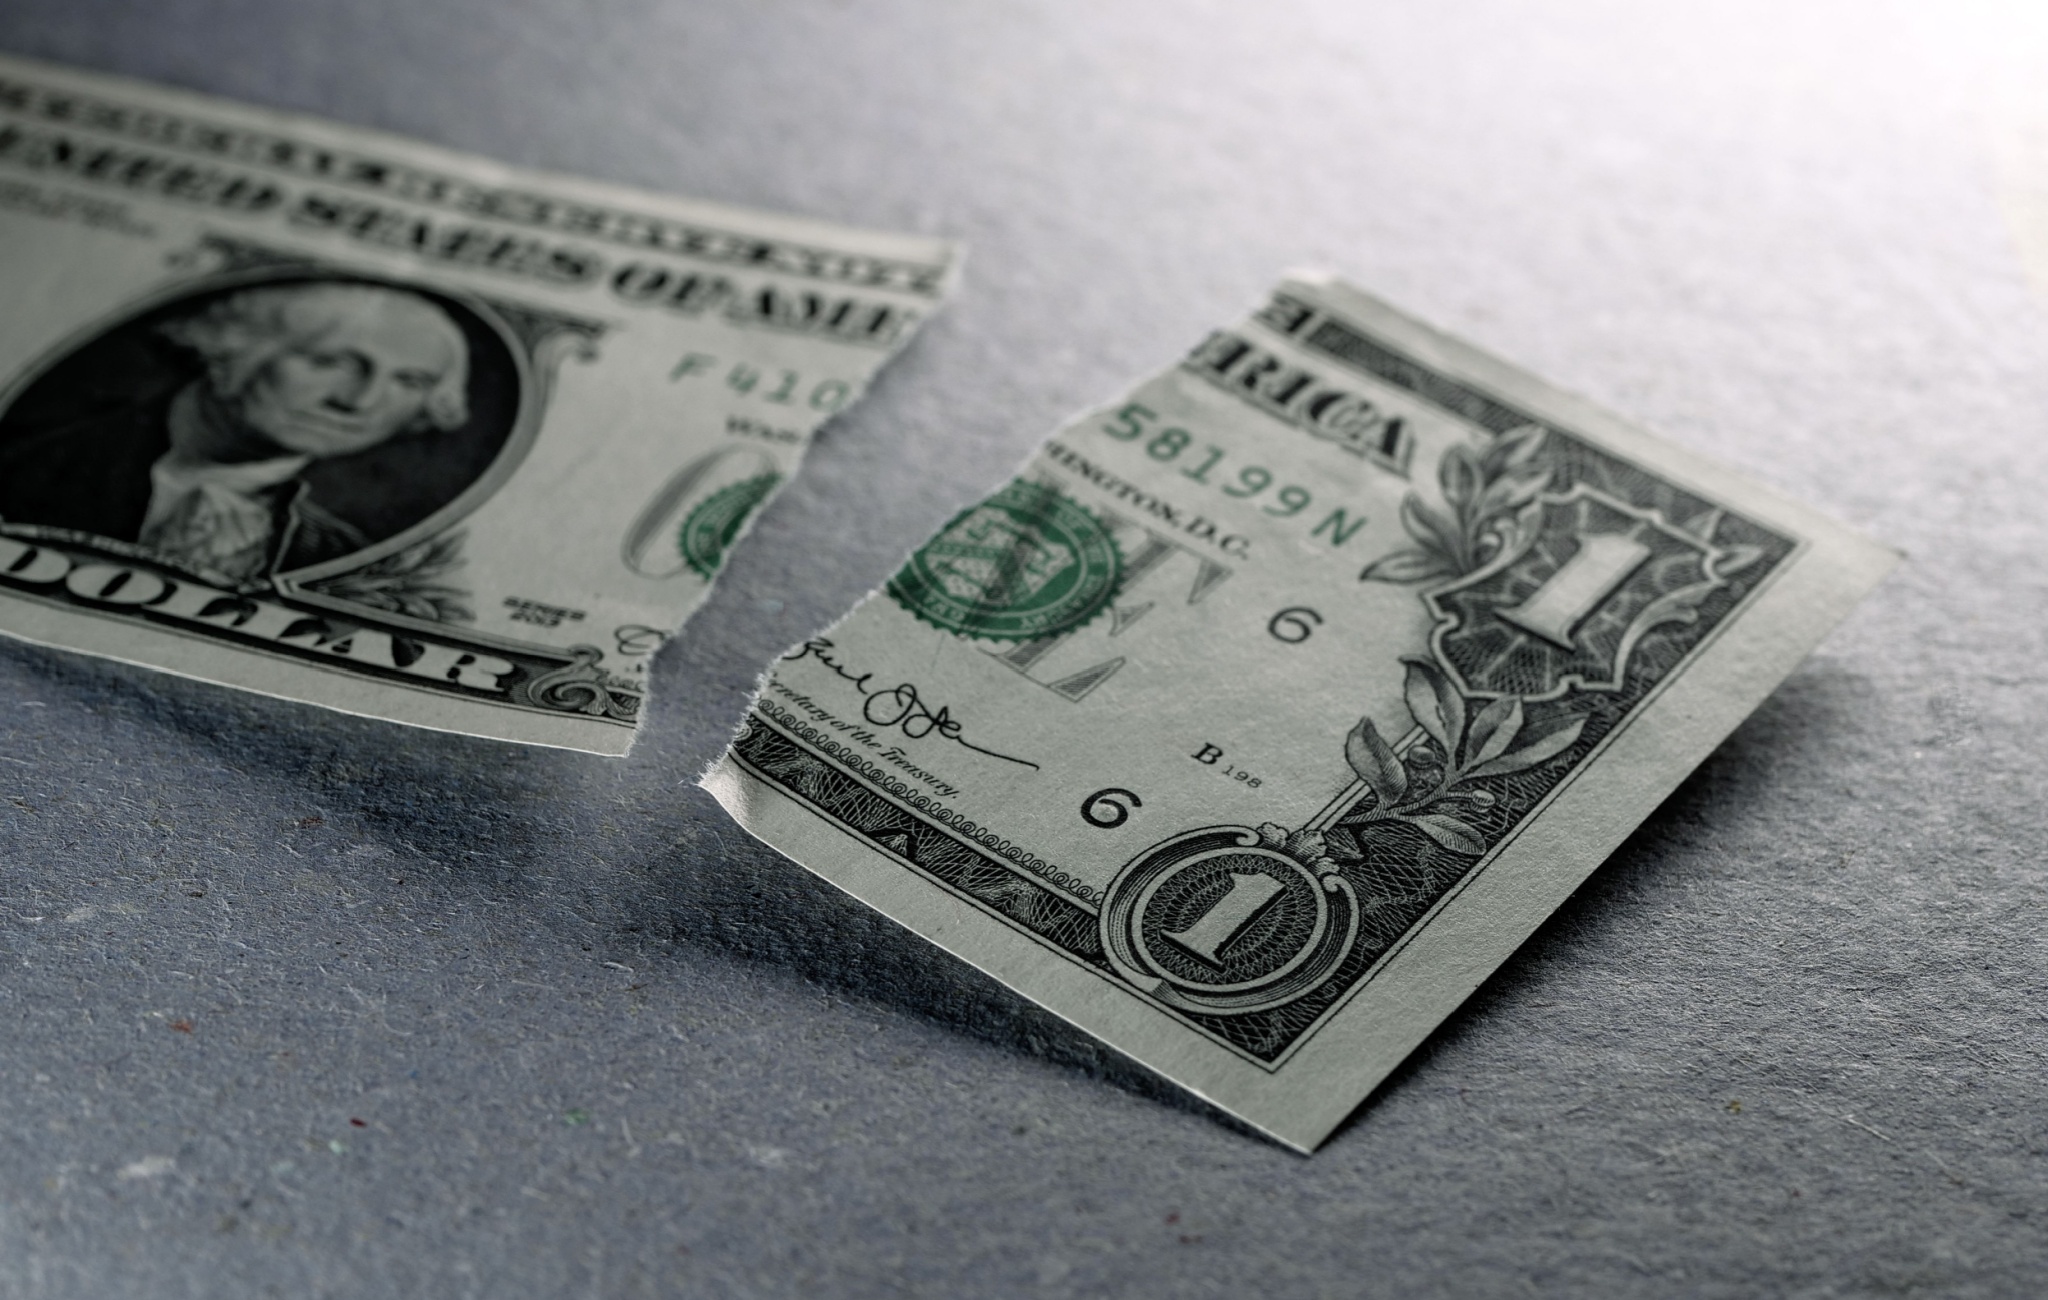
- Printing money beyond the value of national resources will result in inflation and cripple the economy. The US has printed $15 trillion in the past decade, and more is likely. $5 trillion has been used for quantitative easing (QE) and another $5 trillion has been printed for COVID relief so far. $10 trillion is half of US GDP – it’s a lot.
- Stock markets can disconnect from their economies in the face of expected currency devaluation. This security price inflation creates a money illusion – stocks are really not worth more.
- Being the richest is no guarantee of continuing wealth. The bigger they are, the harder they fall.
Conclusion
It is possible – even likely – that US investors are buying stocks as a hedge against inflation. That explains why the stock market keeps going up despite a lot of bad news like inflation, border crisis, Ukraine war, Congressional disfunction, etc.
We should be concerned about falling into the same trap that the Venezuelans did not too long ago in 2016.
The views and opinions expressed herein are the views and opinions of the author and do not necessarily reflect those of Nasdaq, Inc.


