


")


")
Ycharts
This article was published on Dividend Kings on Monday, March 6th.
—————————————————————————————
A Recession is likely coming this year or next year. As I explain in this article, paradoxically, the US economy is currently too strong to avoid recession.
- 3 Legendary Dividend Blue-Chips Perfect For This Recession
So naturally, the media is happy to try to scare investors with headlines like this.
Business Insider
And that’s a reasonable article backed up by facts. The media loves click-bait headlines even more, such as this one.
Ycharts
Kiyosaki is one of the most entertaining doomsday prophets. He has spent over a decade predicting imminent 90% market crashes and the collapse of the global economy.
Is he completely wrong? No, tragically, every day, 19,700 people, on average, starve to death. That’s one death from starvation every four seconds. But it has nothing to do with the imminent collapse of the financial system, and it’s certainly no reason to sell your stocks.
What’s the truth? The truth is a lot less exciting than these headlines make out and agrees with Morgan Stanley’s estimates that stocks COULD fall about 20% more from here.
S&P Bear Market Bottom Scenarios
| Earnings Decline In 2023 | 2023 S&P Earnings | X 25-Year Average PE Of 16.8 | Decline From Current Level |
| 0% (consensus range) | $216.56 | $3,644.70 | 10.4% |
| 5% (consensus range, most likely outcome) | $205.73 | $3,462.47 | 14.9% |
| 10% (consensus range) | $194.90 | $3,280.23 | 19.4% |
| 13% (average recession since WWII) | $188.41 | $3,170.89 | 22.1% |
| 15% | $184.08 | $3,098.00 | 23.8% |
| 20% | $173.25 | $2,915.76 | 28.3% |
(Source: Dividend Kings S&P Valuation Tool, Bloomberg Consensus)
No, my friends, starvation isn’t coming, and no financial crisis is looming.
But stocks are modestly overvalued and not priced for a mild recession.
The most likely outcome is a 15% decline sometime between June and September. That might sound scary, but it’s not.
Charlie Bilello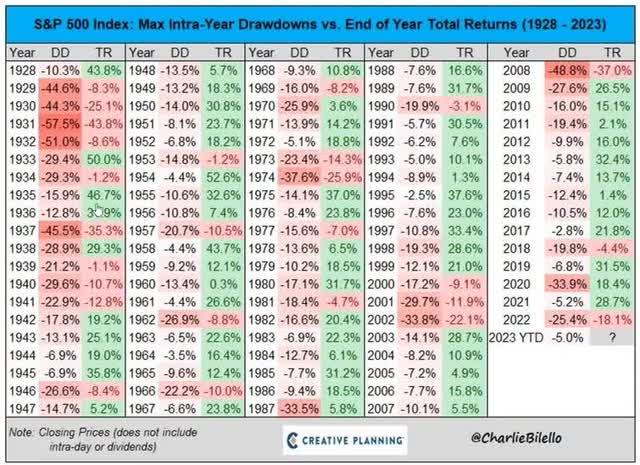
The average peak intra-year for US stocks is 16%. And that includes 76% of years when stocks finish positive.
In any given year, a 16% decline in the market should be expected, and it can be caused by anything.
What if BAC is right and stocks do end up falling about 26% more to 3,000 on the S&P? That will likely be the bottom, and BAC expects the market to finish the year at 4,000.
- a POTENTIAL 33% rally off the bottom
- in a matter of months
In other words, those that give into the doomsday prophets like Kiyosaki, fearing a 15% correction is the start of a 90% crash, are likely to be very sorry.
Charlie Bilello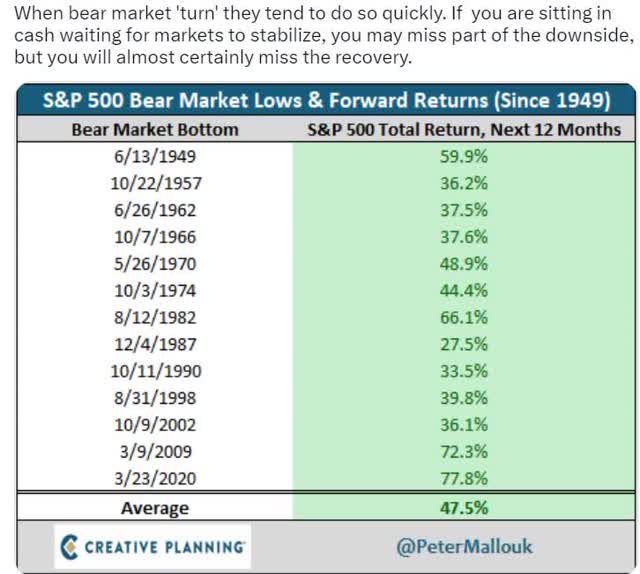
When the market finally bottoms, the new bull market tends to be more ferocious than the bear market. If you panic sell, or fall in love with cash, or god forbid, short the market, you could get your face ripped off, and miss out on life-changing gains.
And that’s where low volatility blue-chips like Johnson & Johnson (NYSE:JNJ) come in.
Let’s review how JNJ is the ultimate sleep-well-at-night or SWAN dividend blue-chip, but also why you might want to consider two superior low-volatility alternatives.
Why Johnson & Johnson Is The Ultimate SWAN Stock
JNJ is one of the lowest volatility stocks on earth. Its average annual decline in any given year is 15%, slightly less than the S&P 500.
That might not seem impressive, but remember, the S&P is 500 companies, and the average annual decline for single stocks is 28%, and 25% for dividend aristocrats.
JNJ Bear Market Peak Declines Since 1985
| Bear Market | JNJ | 60/40 | S&P |
| 2022 Stagflation | 7% | -21% | -28% |
| Pandemic Crash | -11% | -13% | -34% |
| 2018 | -6% | -9% | -21% |
| 2011 | -1% | -16% | -22% |
| Great Recession | -28% | -44% | -58% |
| Tech Crash | -19% | -22% | -50% |
| July 1998 to October 1998 | -6% | -10% | -22% |
| 1990 Recession | 0% | NA | -20% |
| 1987 Black Monday Period | -26% | NA | -36% |
| Average | -10% | -19% | -32% |
| Peak Decline Vs. S&P 500 | -69% | -40% | 0% |
(Sources: Portfolio Visualizer Premium, Charlie Bilello.)
JNJ’s average peak decline during bear markets is a remarkably low 10%, 70% less than the S&P 500. Heck, it’s 60% less than a 60/40 retirement portfolio that’s 40% bonds!
What manner of sorcery allows JNJ to offer such mind-blowing low volatility?
Let’s start with its ultra-low fundamental risk.
- Which Buffett defines are the risk of losing all your money
JNJ Credit Ratings
| Rating Agency | Credit Rating | 30-Year Default/Bankruptcy Risk | Chance of Losing 100% Of Your Investment 1 In |
| S&P | AAA Stable Outlook | 0.07% | 1428.6 |
| Moody’s | Aaa (AAA equivalent) Stable | 0.07% | 1428.6 |
| Consensus | AAA Stable Outlook | 0.07% | 1428.6 |
(Sources: S&P, Moody’s)
JNJ is one of two US companies with AAA credit ratings, which are better than the US Treasury.
- S&P rates the US AA+ stable = 0.29% 30-year default risk
Effectively, S&P estimates that JNJ is as close to a “risk-free” stock as can ever exist.
- MSFT is the only other AAA-rated company
JNJ’s business model is as defensive as they come, a highly diversified portfolio of patented drugs and medical devices.
FactSet Research Terminal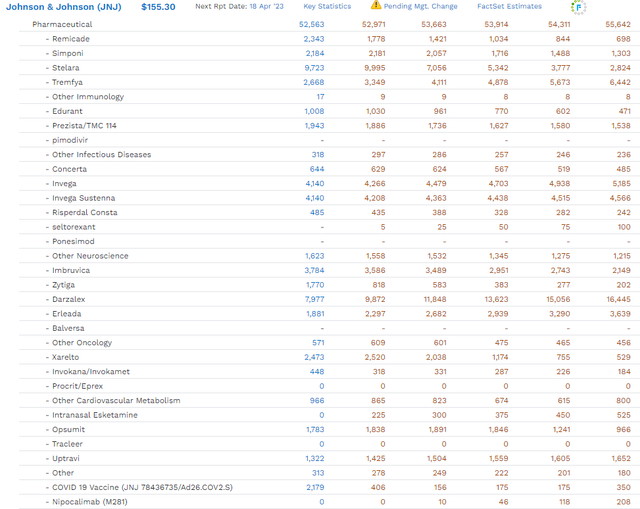
JNJ’s drug portfolio is among the most diverse in the industry, with no single drug making up more than 15% of its drug sales.
Its drug pipeline comprises 109 new drugs/indications, including 14 that management thinks can be $1+ billion annual blockbusters by 2025.
- Analysts expect 11 blockbusters from JNJ by 2025
That includes the cancer drug Darzalex, which is expected to double its annual sales from $7 billion to $16 billion by 2027.
The key to JNJ’s incredibly stable and recession-resistant drug sales is its R&D war chest.
Ycharts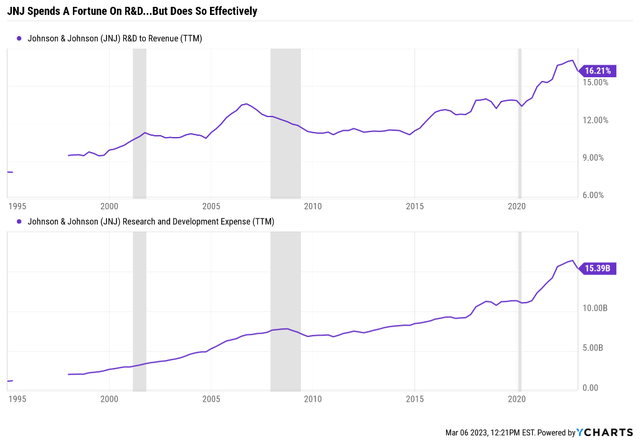
In 2022, JNJ spent $14 billion on R&D, compared to $138 billion for the top 15 Pharma giants.
Analysts expect JNJ’s R&D spending to grow to $16.6 billion in the coming six years by 2028.
FactSet Research Terminal
JNJ is also the world’s largest medical device maker, and that business is expected to grow its sales by 6% annually through 2028, three times faster than its drug sales.
What about its consumer health business? The one facing about 40,000 lawsuits, mostly over claims that its talcum powder caused ovarian cancer?
That is being renamed Kenvue and spun out into a separate company, to end the headache for JNJ investors.
On January 30th, the US appeals court rejected JNJ’s attempts at the “Texas two-step,” which would put all 40,000 lawsuits into a new subsidiary and file for bankruptcy.
However, over 1,500 cases have already been dismissed by judges. Headline-grabbing verdicts such as $2 billion for 22 plaintiffs in Missouri are in appeals and will almost certainly be overturned.
The science is on JNJ’s side, and so are judges, unlike juries who love to “stick it to big pharma with other people’s money.”
NAD = no abnormality detected ((Source: FDA))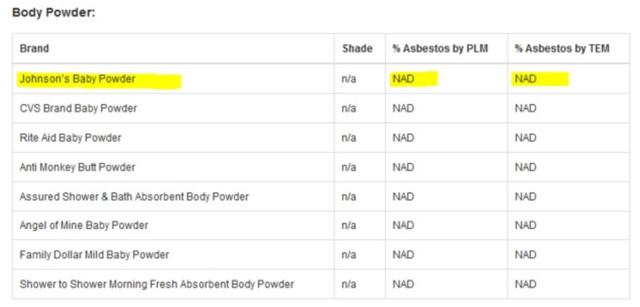
The FDA has found no asbestos in any talcum powder, not just JNJ’s.
But in lawsuit-happy America, people are allowed to pursue frivolous lawsuits, and so they do.
Johnson & Johnson will end global sales of baby powder containing the mineral talc in 2023, switching to a formulation based on corn starch.” – British Medical Journal
Only time will tell whether people start suing JNJ over this new formula, perhaps claiming the corn starch made them fat.
What does Kenvue’s spin-off mean for JNJ investors?
FactSet Research Terminal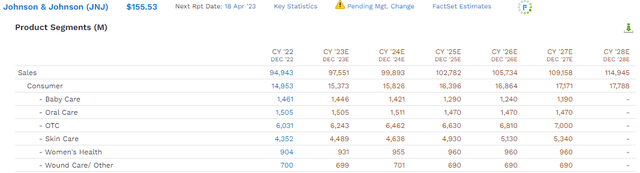
Last year consumer health, including brands like Tylenol, Listerine, Neutrogena, and Nicorette, generated $15 billion, or 16% of the company’s sales.
Those are sales that don’t require patents and thus have very stable revenue, growing at 3.1%, about 50% faster than its drugs.
JNJ has promised that the spin-off will be tax-free and won’t affect the dividend or its 59-year dividend growth streak.
But there is one downside to the spin-off, forced on it by those 40,000 frivolous lawsuits.
JNJ’s Growth Prospects Leave Much To Be Desired
| Investment Strategy | Yield | LT Consensus Growth | LT Consensus Total Return Potential | Long-Term Risk-Adjusted Expected Return |
| ZEUS Income Growth (My family hedge fund) | 4.3% | 10.3% | 14.6% | 10.2% |
| Schwab US Dividend Equity ETF | 3.6% | 9.4% | 13.0% | 9.1% |
| Vanguard Dividend Appreciation ETF | 2.2% | 10.0% | 12.2% | 8.5% |
| Nasdaq | 0.8% | 10.9% | 11.7% | 8.2% |
| Dividend Aristocrats | 1.9% | 8.5% | 10.4% | 7.3% |
| S&P 500 | 1.7% | 8.5% | 10.2% | 7.1% |
| REITs | 3.9% | 6.1% | 10.0% | 7.0% |
| Johnson & Johnson | 2.9% | 4.6% | 7.5% | 5.3% |
| 60/40 Retirement Portfolio | 2.1% | 5.1% | 7.2% | 5.0% |
(Sources: DK Research Terminal, FactSet, Morningstar)
It’s a good thing that JNJ is less volatile than a 60/40 because that’s about the only thing it is expected to outperform in the future.
So here are some superior low-volatility SWAN alternatives to JNJ.
Why Verizon And WEC Energy Group Are Better SWAN Alternatives To JNJ
Here’s a very simple screen for the best low-volatility SWANs.
- reasonable price or better
- low volatility list (20% or less average over the last 15 years)
- 3+% yield (better than JNJ)
- 8+% long-term return potential (better than JNJ)
- non-speculative
Dividend Kings Zen Research Terminal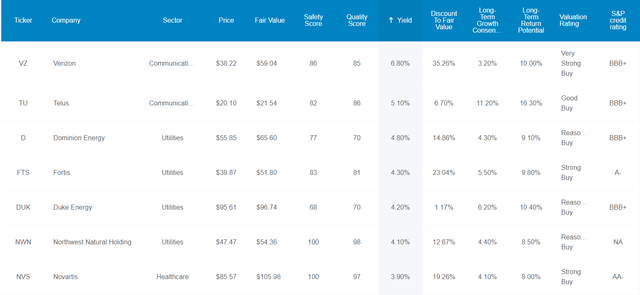
Here are the results sorted by highest yield. Note how Verizon (VZ) is the highest-yielding low volatility SWAN you can safely buy today.
| Bear Market | VZ | 60/40 | S&P |
| 2022 Stagflation | -20% | -21% | -28% |
| Pandemic Crash | -12% | -13% | -34% |
| 2018 | 7% | -9% | -21% |
| 2011 | -1% | -16% | -22% |
| Great Recession | -34% | -44% | -58% |
| Tech Crash | -52% | -22% | -50% |
| July 1998 to October 1998 | -3% | -10% | -22% |
| 1990 Recession (May To October) | 3% | NA | -20% |
| 1987 Black Monday Period | -15% | NA | -36% |
| Average | -14% | -19% | -32% |
| Average Peak Decline Vs. S&P 500 | -56% | -40% | NA |
| Median | -12% | -16% | -28% |
| Median Peak Decline Vs. S&P 500 | -57% | -43% | NA |
(Sources: Portfolio Visualizer Premium, Charlie Bilello.)
Verizon’s volatility is impressively low during bear markets, and today you can buy it at an incredible discount of 35%.
Verizon Summary Stats
Further Reading: Verizon And AT&T: One Could Potentially Triple In 5 Years
- current price $38.22
- fair value: $59.04
- discount: 35%
- DK quality rating: 85% quality medium-risk 12/13 Super SWAN
- DK rating: potential very strong buy
FAST Graphs, FactSet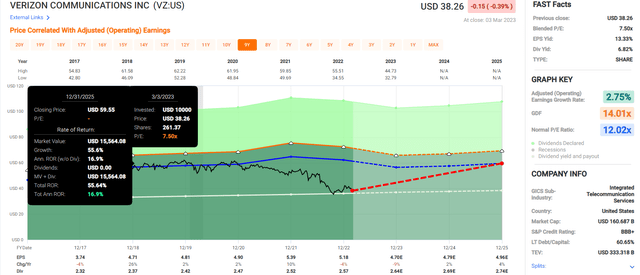
Verizon isn’t a fast-growing company, but it’s trading at 8X 2023 earnings, an anti-bubble valuation pricing in -1% growth.
Its 3.5% expected growth rate is enough to deliver double-digit long-term returns, which is about 50% more than JNJ is expected to generate.
What about WEC Energy (WEC)? This is the largest utility in Wisconsin, and its historical volatility is on par with JNJ’s.
Ycharts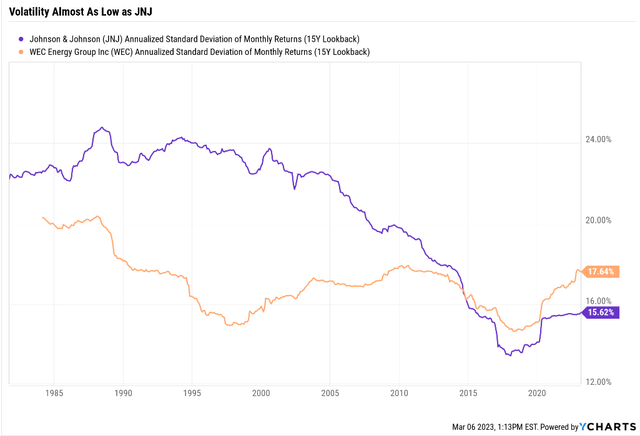
Further Reading
- WEC Energy Group: An Attractive Name For The Long Term
Summary Facts
- DK quality rating: 85% low risk 12/13 Super SWAN utility
- Fair value: $111.29
- Current price: $89.62
- Historical discount: 20%
- DK rating: potential strong buy
- Yield: 3.5%
- Long-term growth consensus: 6.6%
- Long-term total return potential: 10.1%
FAST Graphs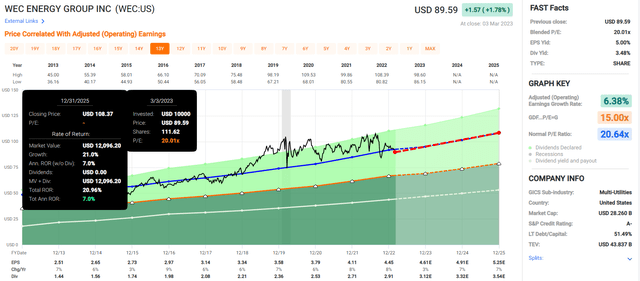
WEC might not look that impressive in the short-term, but take a look at its long-term return consensus.
| Investment Strategy | Yield | LT Consensus Growth | LT Consensus Total Return Potential |
| Verizon | 6.8% | 3.50% | 10.3% |
| S&P 500 | 1.7% | 8.5% | 10.2% |
| WEC Energy Group | 3.5% | 6.60% | 10.1% |
| Johnson & Johnson | 2.9% | 4.6% | 7.5% |
(Sources: DK Research Terminal, FactSet, Morningstar)
Who says that low volatility needs to mean poor returns? Not when you combine very safe high-yield and modest to decent growth.
Bottom Line: The Right Dividend SWAN Can Help You Ride Out The Coming Correction And Enjoy The Next Bull Market
Let me be clear: I’m NOT calling the bottom in JNJ, VZ, or WEC (I’m not a market-timer).
Not even 13/13 Ultra SWAN quality does NOT mean “can’t fall hard and fast in a bear market.”
Fundamentals are all that determine safety and quality, and my recommendations.
- over 30+ years, 97% of stock returns are a function of pure fundamentals, not luck
- in the short term; luck is 25X as powerful as fundamentals
- in the long term, fundamentals are 33X as powerful as luck
While I can’t predict the market in the short term, here’s what I can tell you about these world-beater Super SWANs.
They represent very low-volatility companies with stable and recession-resistant cash-flows.
They have strong balance sheets:
- VZ: BBB+ = 5% fundamental risk
- WEC: A- credit rating = 2.5% fundamental risk
Their management is skilled, trustworthy, and has good to great long-term risk management, according to S&P.
- JNJ: 77th global percentile = low risk
- VZ: 48th percentile = medium-risk
- WEC: 68th percentile = low risk
And most of all, VZ and WEC can give you superior very safe high-yield with superior long-term income and total return potential.
All in a low volatility package to help you sleep well at night in the coming months as we wait for the 2023 recession to begin, end, and the new bull market to begin.