syahrir maulana
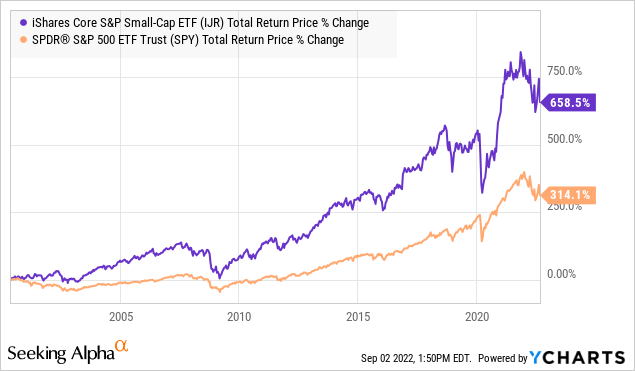
The iShares Core S&P Small-Cap ETF (NYSEARCA:IJR) offers exposure to a diversified basket of small-capitalization U.S. companies. While this is a market segment recognized as being more volatile and generally higher-risk compared to large-cap “blue-chips”, the attraction here is a recognition of an academically tested theory known as the small-firm effect or small-cap anomaly. Simply put, smaller companies are seen as having greater growth opportunities and generating higher risk-adjusted returns. Indeed, the IJR ETF has returned over 655% since the fund’s inception back in 2000 compared to 314% from in the S&P 500 (SPY) over the period.
On the other hand, 2022 has proven to be historically challenging for equities amid several macro headwinds including record inflation and climbing interest rates. IJR is currently down about 21% from its 2021 high, effectively in a bear market. Still, we think the fund works great as a long-term portfolio holding and we view the recent selloff as a buying opportunity.
What is the IJR ETF?
IJR technically tracks the S&P 600 Index which is comprised of companies with a market value between $850 million and $3.7 billion through a float-adjusted weighting methodology. Other eligibility requirements include a daily trading volume threshold. Importantly, what sets this index apart is the requirement that every underlying index constituent is “financially viable”, which considers positive earnings over the last four quarters.
This final point is in contrast to other “small-cap” indexes and tracking ETFs like the iShares Russell 2000 ETF (IWM) which takes an all-in approach with a much larger portfolio of 2000 stocks as well as a lower market cap requirement. The Vanguard Small Cap ETF (VB), technically the largest small-cap fund by AUM at $120 billion, tracks the separate “CRSP US Small Cap Index” which currently includes 1,520 stocks. There is also the Schwab U.S. Small-Cap ETF (SCHA), which is based on the “Dow Jones U.S. Small-Cap Total Stock Market Index”
Without the profitability requirement of the S&P 600 Index, alternative small-cap funds like IWM, VB, and SCHA end up including hundreds of additional lower quality and more speculative stocks. In other words, the fundamental-based inclusion criteria of IJR help to narrow the universe of potential stocks down by excluding companies that are financially challenged. The evidence is clear that this strategy simply works.
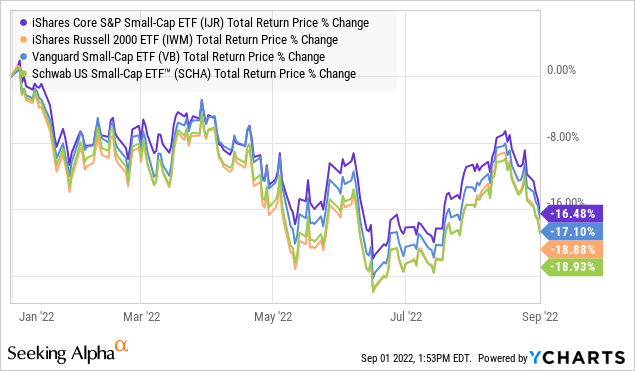
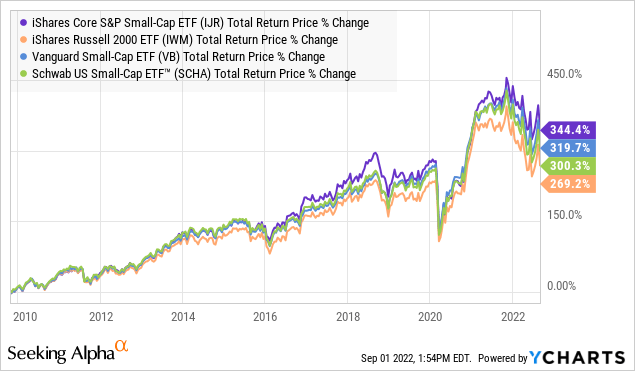
IJR has outperformed IWM, VB, and SCHA both this year with a marginally smaller loss, while effectively delivering excess returns over the past decade. Since 2009 when all four funds were trading, IJR has returned 344% compared to 320% from VB, 300% by SCHA, and 269%. On an annual basis, the differences are marginal but it’s clear that it adds up. Of course, it’s always possible any of these funds can lead higher over any particular time frame, although there’s a case to be made that the “core” strategy of IJR is simply superior over the long run.
Taking a look at the current portfolio, the largest position in the fund beyond the “cash” holding is a group of about 25 stocks, each with a weighting of around 0.5%. Technically, Agree Realty Corp (ADC) with a 0.65% weighting was the latest investment last month, although the relative rankings are expected to change daily depending on the individual stock price trading action.
The takeaway here is that the IJR portfolio is extensive enough that no single company stands out with an overweight position, dominating the performance. Again, the strategy intends to work as a passive instrument with diversified exposure to this market style. By sector, financials are the most represented at 17% of the fund, followed by industrials at 16% and technology names at 14%.
Seeking Alpha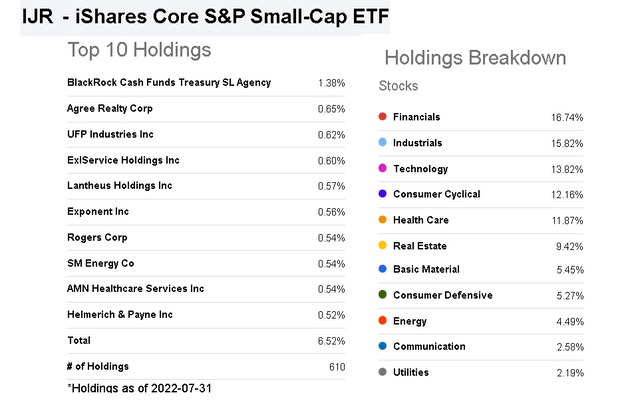
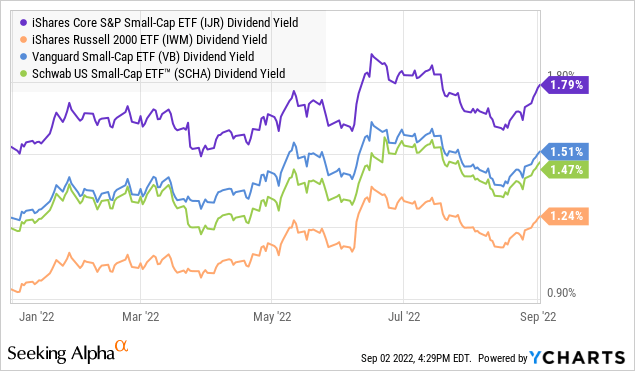
The other side focusing only on profitable companies is that IJR ends up offering a higher dividend yield at 1.8%, compared to 1.5% for VB and SCHA, or 1.2% in IWM. Part of this dynamic reflects IJR’s underweight exposure to the “healthcare” sector relative to the other funds IWM and VB, considering development stage biotech names are often a hallmark of micro- and small-caps and do not typically pay a dividend or generate current profitability.
IJR Price Forecast
The market environment has been terrible, defined by poor sentiment and weak momentum. The concern is that the Fed’s effort to bring down inflation which reached 9.1% in June, a four-decade high, through aggressive rate hikes will result in a significant slowdown in economic activity. Indicators over the last few months have been mixed between some positives like a resilient labor market and rebounding consumer sentiment, while other measures continue to weaken between a correcting housing market and retail spending.
That being said, the bullish case for IJR and small-caps is that the selloff over the past year has already priced in some of the worst-case scenarios. The silver lining to the market correction is that valuations have been reset lower, leading to compelling value in an environment where economic conditions evolve better than expected.
For us, the most positive indicator for equities now is the sign that inflation is trending lower. .,9edx more than 25% from the national average from their peak in June which is providing some relief to consumers. Commodity prices sharply lower over the last few months are helping to ease supply chain disruptions.
The potential that the CPI continues to surprise to the downside through the end of the year can open the door for the Fed to adjust its messaging through a less aggressive quantitative tightening requirement. A more stable outlook can be positive for stocks and we expect the IJR ETF to lead higher. While “the bottom” in the market may or may not already be in, we view the current spot as a great opportunity to start adding exposure with a call that IJR will be trading higher from here over the next few months going forward.
source: finviz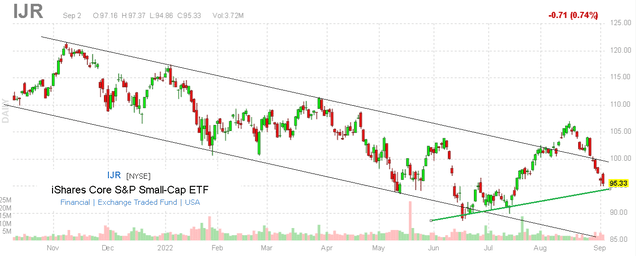
Final Thoughts
IJR is a high-quality ETF that deserves a spot in every investor’s portfolio as a core holding for the long run. Small-caps are an important market segment that has historically delivered positive returns. IJR with an expense ratio of just 0.06% may be among the best in this category.


