Viorika
By Stephen H. Dover, Chief Market Strategist and Head of Franklin Templeton Institute
Originally published in Stephen Dover’s LinkedIn Newsletter Global Market Perspectives.
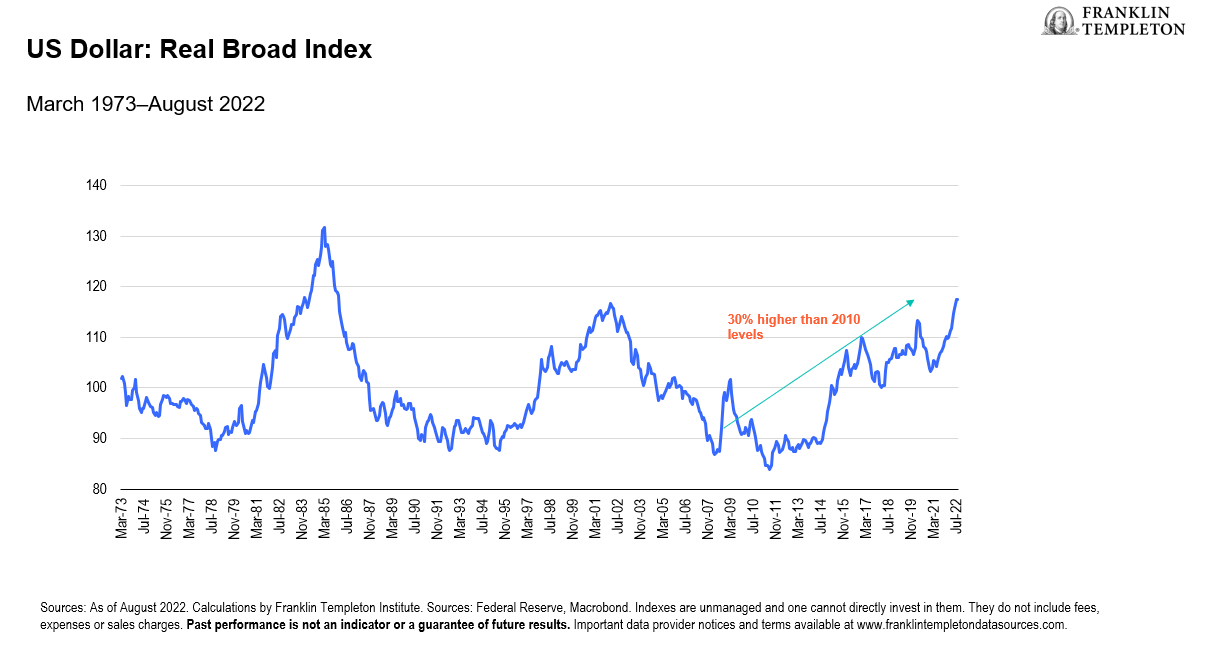
The US dollar has now been strengthening for 11 years now, making this the longest US dollar strengthening cycle in history. Over the past 15 months, the US dollar has strengthened at an accelerated rate. Since May 2021, the nominal broad US dollar index – a measure of the trade-weighted value of the US dollar against other advanced and emerging economy currencies – has risen 10%.1 That is its strongest advance since 2014-2016 and takes the dollar index to its highest level since 2002.2
Adjusted for differences in national rates of inflation, the real trade-weighted value of the US dollar has also risen sharply over the past year, continuing a trend underway for over a decade. In inflation-adjusted ((real)) terms, the US dollar now stands nearly 30% above its 2010 levels. (See Exhibit 1 below.)
Exhibit 1: Strengthening US Dollar

Why is the US dollar so strong?
Although much of recent commentary regarding US dollar appreciation centers on differences in monetary policy – the Federal Reserve (FED) has hiked rates faster and more often this year than the European Central Bank, for example – the extended period of US dollar appreciation over the past decade suggests that other factors are also at work.
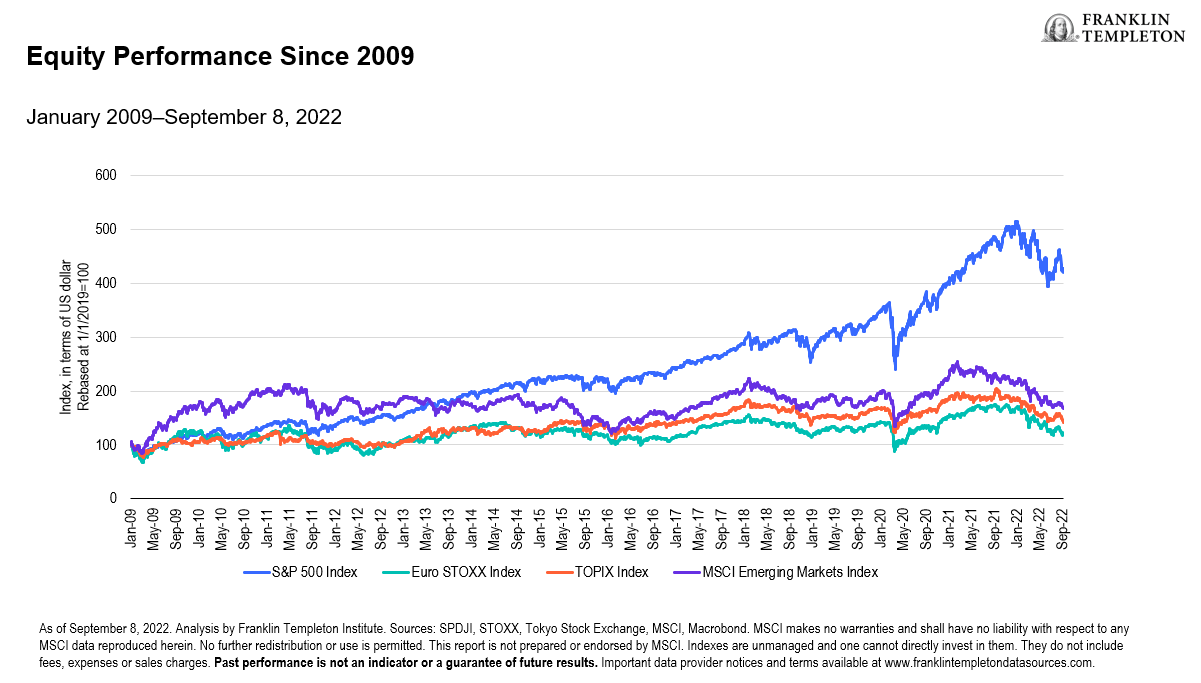
Long-term trends in exchange rates typically reflect persistent differences in economic growth rates and returns on capital. In the nearly 15 years since the global financial crisis (GFC), the US economy has grown faster, on average, than its major developed peers. Faster growth tends to attract capital from abroad in search of higher returns. Much of that money flowed into the US equity market, which has consistently outperformed both its developed and emerging market competitors since 2009.
Exhibit 2: US Equity Market Outperformed Other Major Markets

Interest rate differentials have also favored the US dollar, even during the prolonged period of low interest rates and quantitative easing following the GFC. As low as the Fed pushed interest rates after 2008, Europe and Japan went even further, forcing policy rates and bond yields into negative territory. Interest rate differentials have widened in the direction of the US dollar, propelling it even higher in 2022.
Finally, the US dollar has also benefitted from its position as a “petro-currency.” Unlike the eurozone, Japan or even China, which are heavily reliant on energy imports, the United States has become energy self-sufficient in this century. The impact of high oil prices on the trade deficit is markedly improved in the United States as it relies less on imported product, as opposed to many emerging markets where they remain dependent on imports. The global disruptions to energy markets unleased by Russia’s invasion of Ukraine have also had a net positive impact on the external value of the US dollar.
When considering the factors that have pushed the US dollar higher in recent years, it is difficult to see how they will soon fade away. A prolonged Russia-Ukraine war (now seemingly in a military stalemate), persistent above-target US inflation that prompts the Fed to hike rates even further, and few signs that other economies will fare better in the ongoing global economic slowdown all suggest that a strong dollar will persist.
What happens to growth, inflation, and policy?
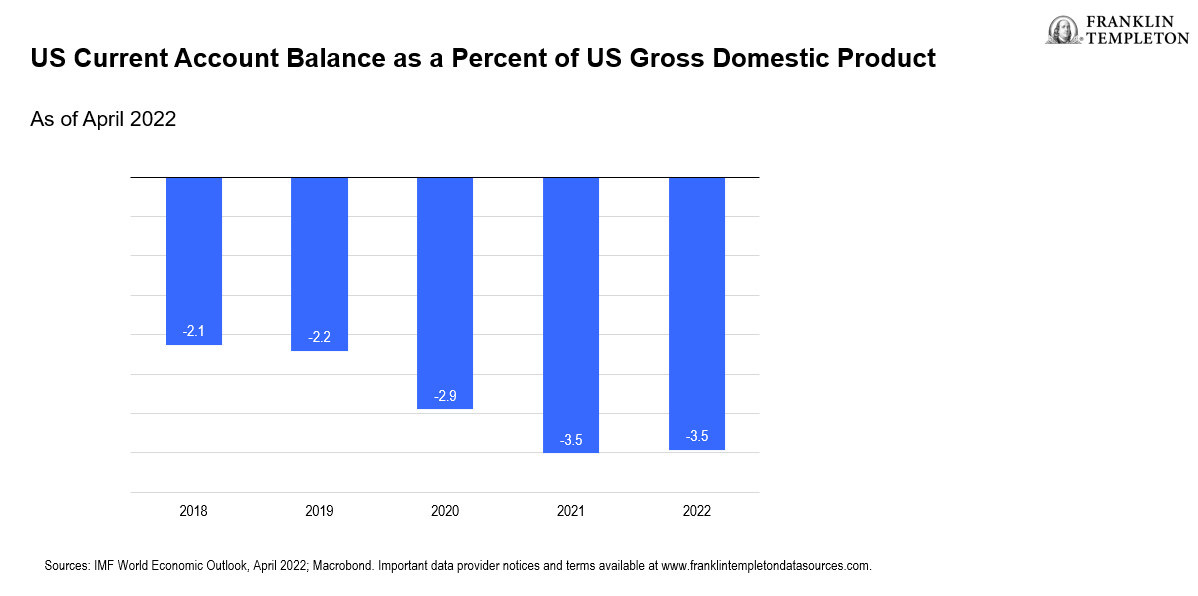
For the United States, an appreciating dollar makes US exports more expensive and imports cheaper. That’s one reason why the US current account deficit – the broadest measure of exports less imports, including goods and services – has begun to deteriorate again since 2019. (See Exhibit 3).
Exhibit 3: Stronger US Dollar Deteriorates Current Account Balance

A larger trade deficit, in turn, slows United States gross domestic product (GDP) growth. At the same time, the weakening of the euro, yen, pound, or renminbi improves the competitiveness of other major economies, offering support for their economic activity.
However, the impact of currency moves on broad measures of growth such as GDP can easily be overstated. For large economies like the United States, the eurozone as a whole, Japan or China, international trade comprises typically less than a fifth of total output.3 Some 80% of their economies are driven instead by domestic sources of activity. Accordingly, a strong US dollar alone is unlikely to worsen the outlook for United States growth significantly. Nor is a weak renminbi, euro, or yen, alone, likely to jump start the economies of China, Europe or Japan.
For similar reasons, currency moves are typically a “rounding error” in terms of inflation outcomes for major economies. Changes in import prices, including for intermediate inputs, don’t show up decisively in prices indices of final consumption. To be sure, for companies and individuals already squeezed by high energy prices, the added cost of importing oil or gas in euro or yen is an added blow.
On the other hand, for smaller economies that are quite open to trade, currency weakness can contribute significantly to higher domestic inflation. That fate particularly befalls energy import dependent emerging economies whose currencies have weakened against the US dollar.
Moreover, in a world where nearly every economy, developed or emerging, is faced with uncomfortably high inflation, a strong US dollar tends to impart a global tightening bias to monetary policy. That’s because the added inflationary impact of currency weakness outside the US forces other central banks to hike even more than would otherwise be the case.
For investors, in other words, the first important implication about US dollar strength is not that it redistributes growth from the United States to the rest of the world, but rather that it leads to tighter monetary conditions worldwide.
For instance, in Europe, despite the prospects of slow growth, the central bank has increased its interest rates to address high inflation. A strong US dollar, therefore, presents an added risk to global growth.
How are capital markets impacted?
Turning to capital markets, a persistently strong dollar will have impacts via cross-border capital flows, the shape of yield curves, the cost of capital, and the redistribution of profits. Each of these impacts can have important effects on returns by asset class, sector, and style.
While stronger relative growth and returns have propelled the US dollar higher in recent years, the result is also a shift in relative valuations, particularly when adjusted for domestic purchasing power. Not only does the US equity market trade on a higher price-to-earnings multiple than its eurozone or Japanese counterparts, but purchasing shares in US companies by European or Japanese investors has become more expensive in their (weaker) domestic currencies.
No trees in the forest of capital markets grow forever into the sky and, at some point, value-oriented investors will begin to search for more attractive investment opportunities. In our view, the end of US dollar strength is likely to coincide with renewed interest in non-dollar assets.
Because a strong US dollar tends to impart a tightening bias to global monetary policy, flatter or more inverted yield curves as markets discount both higher policy rates, but weaker future growth is also a likely result. For equity investors, that is typically a poor environment for value or cyclical styles, and more conducive to growth or quality investing. For fixed income investors, this can result in unique opportunities relative to duration (see our prior newsletter entitled “How Duration Affects Stocks and Bonds”).
US dollar strength driven by, among other things, high US inflation and aggressive Fed tightening, will also tend to increase market volatility, both in currencies and other asset classes. That is simply what happens at major cyclical turning points. In that environment, large currency moves can increase risk premia more generally, leading to a higher cost of capital and weaker business investment spending, leading to lower earnings and valuations. Foreign investors would also face additional currency hedging costs.
Finally, a strong dollar tends to redistribute corporate profits, particularly for larger- capitalization equity indexes. For example, roughly one third of total S&P 500’s corporate profits are sourced abroad in other currencies. When the US dollar appreciates, US multinationals translate those euro, yen or renminbi earnings into fewer dollars lowering measures of US corporate profitability. Meanwhile, the opposite happens in Europe, Japan and elsewhere, where those multinationals report hiring local currency earnings courtesy of the positive impact of earning in US dollars but reporting in euro or yen.
What does this all mean?
So, what can we conclude from the above?
First, the reasons behind the US dollar’s impressive appreciation in 2022 and in prior years seem unlikely to reverse anytime soon. Investors, policymakers and ordinary citizens will probably have to live with a strong dollar for longer.
Second, a strong US dollar will likely have an asymmetric impact on global growth outcomes given its impacts on monetary policy. Global growth will likely be somewhat weaker because of a strong US dollar.
Third, recent US dollar appreciation has been rapid, contributing to higher currency and capital market volatility. Cyclical turning points, such as what we are now experiencing, tend to increase risk premia, which tends to depress valuations.
Fourth, in the medium term, a strong US dollar will tend to curb US growth and inflation, while it lifts foreign growth and inflation. Those opposing outcomes will eventually contribute to a narrowing of the gap between expected monetary policy outcomes worldwide. Accordingly, interest differentials which have driven the US dollar higher this year may soon reach their widest point and provide maximum levels of support for the US dollar.
Finally, a strong US dollar makes US assets expensive relative to foreign assets, which eventually induces a reversal of cross-border capital flows. The same is true for profitability – US dollar strength tends to lower US company profitability relative to foreign firms, which eventually leads to a reallocation of capital and capital flows that will eventually push the US dollar lower.
Footnotes1. As of August 2022. Calculations by Franklin Templeton Institute. Sources: Federal Reserve, Macrobond. Indexes are unmanaged and one cannot directly invest in them. They do not include fees, expenses or sales charges. Past performance is not an indicator or a guarantee of future results. Important data provider notices and terms available at www.franklintempletondatasources.com. 2. Ibid. 3. Source: IMF (IFS, International Financial Statistics) as of second quarter 2022. |
WHAT ARE THE RISKS?All investments involve risks, including possible loss of principal. The value of investments can go down as well as up, and investors may not get back the full amount invested. Stock prices fluctuate, sometimes rapidly and dramatically, due to factors affecting individual companies, particular industries or sectors, or general market conditions. Bond prices generally move in the opposite direction of interest rates. Thus, as prices of bonds in an investment portfolio adjust to a rise in interest rates, the value of the portfolio may decline. Investments in foreign securities involve special risks, including currency fluctuations, economic instability and political developments. Investments in emerging market countries involve heightened risks related to the same factors, in addition to those associated with these markets’ smaller size, lesser liquidity and lack of established legal, political, business and social frameworks to support securities markets. Such investments could experience significant price volatility in any given year. IMPORTANT LEGAL INFORMATIONThis material is intended to be of general interest only and should not be construed as individual investment advice or a recommendation or solicitation to buy, sell or hold any security or to adopt any investment strategy. It does not constitute legal or tax advice. This material may not be reproduced, distributed or published without prior written permission from Franklin Templeton. The views expressed are those of the investment manager and the comments, opinions and analyses are rendered as at publication date and may change without notice. The underlying assumptions and these views are subject to change based on market and other conditions and may differ from other portfolio managers or of the firm as a whole. The information provided in this material is not intended as a complete analysis of every material fact regarding any country, region or market. There is no assurance that any prediction, projection or forecast on the economy, stock market, bond market or the economic trends of the markets will be realized. The value of investments and the income from them can go down as well as up and you may not get back the full amount that you invested. Past performance is not necessarily indicative nor a guarantee of future performance. All investments involve risks, including possible loss of principal. Any research and analysis contained in this material has been procured by Franklin Templeton for its own purposes and may be acted upon in that connection and, as such, is provided to you incidentally. Data from third party sources may have been used in the preparation of this material and Franklin Templeton (“FT”) has not independently verified, validated or audited such data. Although information has been obtained from sources that Franklin Templeton believes to be reliable, no guarantee can be given as to its accuracy and such information may be incomplete or condensed and may be subject to change at any time without notice. The mention of any individual securities should neither constitute nor be construed as a recommendation to purchase, hold or sell any securities, and the information provided regarding such individual securities (if any) is not a sufficient basis upon which to make an investment decision. FT accepts no liability whatsoever for any loss arising from use of this information and reliance upon the comments, opinions and analyses in the material is at the sole discretion of the user. Products, services and information may not be available in all jurisdictions and are offered outside the U.S. by other FT affiliates and/or their distributors as local laws and regulation permits. Please consult your own financial professional or Franklin Templeton institutional contact for further information on availability of products and services in your jurisdiction. Issued in the U.S. by Franklin Distributors, LLC, One Franklin Parkway, San Mateo, California 94403-1906, (800) DIAL BEN/342-5236, franklintempleton.com – Franklin Distributors, LLC, member FINRA/SIPC, is the principal distributor of Franklin Templeton U.S. registered products, which are not FDIC insured; may lose value; and are not bank guaranteed and are available only in jurisdictions where an offer or solicitation of such products is permitted under applicable laws and regulation. Canada: Issued by Franklin Templeton Investments Corp., 200 King Street West, Suite 1500 Toronto, ON, M5H3T4, Fax: (416) 364-1163, (800) 387-0830, www.franklintempleton.ca Offshore Americas: In the U.S., this publication is made available only to financial intermediaries by Franklin Distributors, LLC, member FINRA/SIPC, 100 Fountain Parkway, St. Petersburg, Florida 33716. Tel: (800) 239-3894 (USA Toll-Free), (877) 389-0076 (Canada Toll-Free), and Fax: (727) 299-8736. Investments are not FDIC insured; may lose value; and are not bank guaranteed. Distribution outside the U.S. may be made by Franklin Templeton International Services, S.à r.l. (FTIS) or other sub-distributors, intermediaries, dealers or professional investors that have been engaged by FTIS to distribute shares of Franklin Templeton funds in certain jurisdictions. This is not an offer to sell or a solicitation of an offer to purchase securities in any jurisdiction where it would be illegal to do so. Issued in Europe by: Franklin Templeton International Services S.à r.l. – Supervised by the Commission de Surveillance du Secteur Financier – 8A, rue Albert Borschette, L-1246 Luxembourg. Tel: +352-46 66 67-1 Fax: +352-46 66 76. Poland: Issued by Templeton Asset Management (Poland) TFI S.A.; Rondo ONZ 1; 00-124 Warsaw. South Africa: Issued by Franklin Templeton Investments SA ((Pty)) Ltd, which is an authorised Financial Services Provider. Tel: +27 (21) 831 7400 Fax: +27 (21) 831 7422. Switzerland: Issued by Franklin Templeton Switzerland Ltd, Stockerstrasse 38, CH-8002 Zurich. United Arab Emirates: Issued by Franklin Templeton Investments (ME) Limited, authorized and regulated by the Dubai Financial Services Authority. Dubai office: Franklin Templeton, The Gate, East Wing, Level 2, Dubai International Financial Centre, P.O. Box 506613, Dubai, U.A.E. Tel: +9714-4284100 Fax: +9714-4284140. UK: Issued by Franklin Templeton Investment Management Limited (FTIML), registered office: Cannon Place, 78 Cannon Street, London EC4N 6HL. Tel: +44 (0)20 7073 8500. Authorized and regulated in the United Kingdom by the Financial Conduct Authority. Australia: Issued by Franklin Templeton Australia Limited (ABN 76 004 835 849) (Australian Financial Services License Holder No. 240827), Level 47, 120 Collins Street, Mellbourne, Victoria 3000. Hong Kong: Issued by Franklin Templeton Investments ((Asia)) Limited, 17/F, Chater House, 8 Connaught Road Central, Hong Kong. Japan: Issued by Franklin Templeton Investments Japan Limited. Korea: Issued by Franklin Templeton Investment Trust Management Co., Ltd., 3rd fl., CCMM Building, 12 Youido-Dong, Youngdungpo-Gu, Seoul, Korea 150-968. Malaysia: Issued by Franklin Templeton Asset Management (Malaysia) Sdn. Bhd. & Franklin Templeton GSC Asset Management Sdn. Bhd. This document has not been reviewed by Securities Commission Malaysia. Singapore: Issued by Templeton Asset Management Ltd. Registration No. (UEN) 199205211E and Legg Mason Asset Management Singapore Pte. Limited, Registration Number (UEN) 200007942R. Legg Mason Asset Management Singapore Pte. Limited is an indirect wholly owned subsidiary of Franklin Resources, Inc. 7 Temasek Boulevard, #38-03 Suntec Tower One, 038987, Singapore. Please visit www.franklinresources.com to be directed to your local Franklin Templeton website. |
Original Post
Editor’s Note: The summary bullets for this article were chosen by Seeking Alpha editors.


