Edlane De Mattos/iStock Editorial via Getty Images
Investment Thesis:
Wabash National Corporation (NYSE:WNC) presents a compelling investment opportunity backed by strong financial performance, including a robust Q2 revenue of $687 million and an operating cash flow of $146 million year to date. The company operates under a strategic “One Wabash” structure, effectively integrating its various business units, thus optimizing operations. While the firm faces market volatility, its strong financial standing—evidenced by a low net debt leverage of 0.9—offers a cushion against short-term market fluctuations. With promising opportunities in reshoring and construction spending, Wabash is well-positioned for long-term growth. These positive attributes make Wabash National Corporation a ‘Buy’ for conservative investors looking for stable, long-term growth.
Overview
Wabash National has been on a financial upswing, reporting a Q2 revenue of $687 million. The company’s strategy revolves around a “One Wabash” structure aimed at integrating various business units, a move that seems to be paying off, given the recent financial results. The company also emphasizes employee engagement as a driving force behind their strong financial performance, which indicates the quality of the management.
On the revenue side, Wabash National is focusing on generating recurring income through parts and services—a segment that has been showing steady growth. The company also sees potential in the freight markets, which they believe are likely bottomed out. This belief is substantiated by their expectation of a more regular peak season ahead. Moreover, they are aligning themselves with the reshoring trend, which is supported by a 77% increase in U.S. construction spending on manufacturing facilities.
From an investment standpoint, the company has raised its EPS guidance for 2023 from $4.25 to $4.45 and projects to generate over $150 million in free cash flow for the same year.
However, there are risks to consider, primarily the downgrade by D.A. Davidson, which led to a stock price of approximately 6% to $20.90. There’s also the seasonal and cyclical volatility in the market, evidenced by a 20% sequential decline in orders.
In terms of financial health, the company has reported a strong operating cash flow of $146 million year-to-date and a net debt leverage of 0.9 times, the lowest since 2017.
Financial Analysis

Author analysis
Segment Analysis
Sales in the Transportation Solutions segment increased by 10.1%, from $1.10 billion in six months ending June 2023 to $1.21 billion in H1 2022, making it the primary revenue driver for the company. This could indicate strong market demand and successful marketing strategies. In contrast, the Parts & Service segment also showed promise, growing by 12.5% from $97.1 million to $109.2 million, a rate even higher than that of Transportation Solutions. This suggests that Parts & Service is a segment ripe for further investment. Total sales increased by 9.9% to $1.31 billion, indicating overall business health.
Gross profit in the Transportation Solutions segment almost doubled with a 108.9% increase, soaring from $113.7 million in six months ending June 2023 to $237.5 million in H1 2022. This could indicate improved operational efficiencies. Meanwhile, the Parts & Service segment also showed a substantial 32% growth in gross profit, reaching $29.5 million, which implies this segment is becoming increasingly profitable. Consequently, the total gross profit improved by 96.2% to $267.05 million.
Despite these positive financial metrics, there’s cause for concern. New units of trailers shipped decreased by 7.5%, falling from 25,535 in six months ending June 2023 to 23,610 units in H1 2022, potentially signaling market saturation and increased competition. Conversely, truck bodies witnessed a 5.4% growth in new units shipped, indicating this could be an area for further focus. Overall, new units shipped contracted by 4.6%, a trend that should be closely monitored. Further, used trailer units experienced a 50% decline, though this is on a much smaller scale and may not be as significant.
Revenue is heavily concentrated in the Transportation Solutions segment, which accounts for about 92% of total sales, indicating a risk of dependency. An upward trend in sales and gross profit suggests solid financial health and operational efficiencies. However, the decline in new units shipped could signal reaching a market saturation point, warranting a strategy reassessment. Furthermore, the significant growth in gross profit indicates high-quality earnings derived from core operations, reinforcing the company’s financial strength.
Based on these metrics, the foreseeable future for Wabash National seems promising, especially if the Parts & Services segment continues to grow at its current rate. Yet, the company must address the declining new units shipped to avert potential future revenue drops. The main risks include an over-reliance on the Transportation Solutions segment and a decrease in new units shipped, both of which could significantly impact future revenues and profits. Therefore, diversifying revenue streams and exploring new markets or sales strategies could mitigate these risks and contribute to long-term financial stability.
Revenue Analysis
Starting with net sales, the company saw a quarter-over-quarter growth of 6.82%, climbing from $642.77 million in Q2 2022 to $686.62 million in Q2 2023. The growth extends to the first half of the year, where net sales increased by 9.93%, from $1,189.53 million in 2022 to $1,307.57 million in 2023. This consistent uptick in sales is a clear indicator of revenue strength.
The Gross Profit Margin stood at 21.99% for Q2 2023, an increase from 12.14% in Q2 2022, marking an 81.3% year-over-year (YoY) improvement, indicative of higher efficiency in cost management and pricing strategy. Gross profit shot up by 93.57% in Q2 2023 compared to Q2 2022, moving from $78.03 million to $151.03 million. For the first half, the growth rate was almost identical at 96.23%, rising from $136.09 million in 2022 to $267.05 million in 2023. These indicate that the company is generating higher sales and retaining more of that as profit.
Moving on to net income, there was a 227.51% surge in Q2 2023 compared to Q2 2022, jumping from $22.74 million to $74.47 million. For the first six months, the growth was 261.71%, increasing from $34.81 million in 2022 to $125.87 million in 2023. This exponential increase signifies that the company is not only earning more but also efficiently managing its expenses.
The Operating Margin also saw an increase to 15.04% in Q2 2023, up from 5.58% in Q2 2022. The operating margin for the first half of 2023 was 13.24%, and the net profit margin was 9.62% signaling operational efficiency. The increase in both gross profit and net income suggests high-quality earnings, primarily generated from the company’s core business rather than non-operational activities like asset sales. The dividend per share remained constant at $0.08 in both Q2 2023 and Q2 2022, offering stability to shareholders.
Given these positive trends, it’s not unrealistic to project that Wabash could reach net sales of around $2.6 billion and a net income of about $250 million by the end of 2023 if it maintains its current growth rates. However, it’s crucial to note that the company’s significant revenue generation from the Transportation Solutions segment could be a risk factor; any downturn in this segment could disproportionately affect Wabash’s overall financial standing.
In summary, each of these financial metrics points to a robust financial performance by Wabash National, substantiated by quantitative growth in net sales, gross profit, and net income, as well as qualitative factors like operational efficiency and earnings quality.
Balance Sheet Analysis
The company’s total assets surged by 15.08%, moving from $1.204 billion as of December 31, 2022, to $1.385 billion on June 30, 2023. This increase in assets is indicative of effective capital allocation strategies, pointing towards a combination of revenue growth and prudent investment in marketable securities. Total liabilities also rose, albeit at a slower rate of 12.23%, from $805.4 million to $903.7 million in the same period. This is an important point because it signifies that the company is financing its growth in a balanced way, without overly leveraging itself.
The company’s current ratio stood at 1.68 for June 2023. This ratio above 1 indicates the company’s capability to meet its short-term obligations, underscoring a healthy liquidity position. The Debt-to-Equity ratio was 0.82, demonstrating a balanced capital structure, and indicating that the company is not overly reliant on debt for its operations and growth, a sign of financial prudence.
The Property, Plant, and Equipment increased by 15.87%, from $271.1 million to $314.1 million. This increase suggests that the company is investing in long-term assets, potentially to expand its operational capacity and to upgrade existing facilities. Cash and cash equivalents showed a growth of 69.56%, from $58.2 million to $98.8 million. This rise in cash reserves indicates strong liquidity, enabling the company to take advantage of new investment opportunities.
Retained earnings grew by 62.52%, from $188.2 million to $305.8 million. This increase is an indicator of the company’s profitability and suggests that these earnings are of high quality—likely derived from core business operations.
In a forward-looking analysis based on the current trends, if the 15.08% growth in assets and 12.23% growth in liabilities continue, the company could see its total assets grow to approximately $1.6 billion and its total liabilities to about $1 billion by year-end.
To sum it up, Wabash National Corporation appears to be in robust financial health, backed by strong ratios and substantial growth in key financial metrics.
Free Cash Flow Analysis
Author analysis
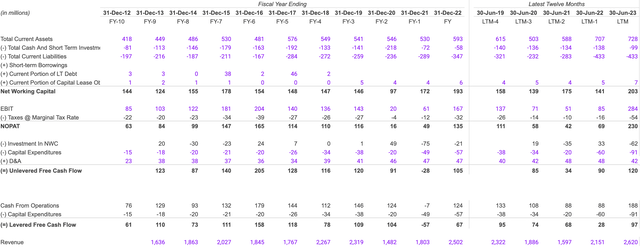
The Net Working Capital (NWC) increased from $141 million in 2022 to $203 million in 2023. This represents a 43.9% growth and indicates a more liquid position for the company in the short term. The growth in NWC suggests the company has more readily available resources to cover short-term obligations and invest in quick opportunities.
EBIT for 2023 is $284 million, a 234% increase from the $85 million in 2022. Similarly, NOPAT increased from $69 million in 2022 to $230 million in 2023, a jump of 233%. This triple-digit growth in both EBIT and NOPAT shows operational excellence and, at the same time, is not sustainable in the future. The EBIT margin increased to 10.8% in 2023 from 3.95% in 2022, reinforcing the strong operating performance.
The revenues were $2,620 million in 2023, a healthy 21.8% increase from $2,151 million in 2022. On the assets and liabilities front, the total current assets rose by 3% from $707 million in 2022 to $728 million in 2023, while total current liabilities remained steady at $433 million.
Cash from operations increased from $88 million in 2022 to $188 million in 2023, marking a 113.6% growth. Levered Free Cash Flow (LFCF) also increased from $28 million in 2022 to $97 million in 2023, a 246.4% jump.
Regarding financial risks, the primary concern would be to validate the sudden and steep growth in EBIT and NOPAT to ensure the growth is sustainable.
Shareholder Yield
Author analysis
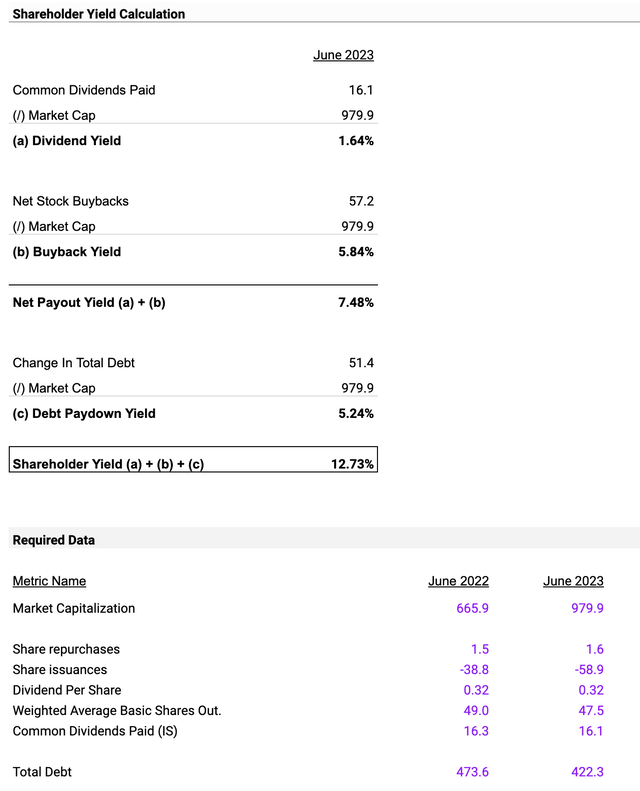
The Dividend Yield is 1.64%, and Buyback Yield is at 5.84%. This is higher than the Dividend Yield, signaling that the company prefers to buy back its shares rather than pay dividends. This indicates that management believes the shares are undervalued.
The Debt Paydown Yield is at 5.24%. This suggests the company is using a chunk of its earnings to reduce debt. Adding the Dividend and Buyback Yields, we get a Net Payout Yield of 7.48%. Moreover, the Shareholder Yield, which combines dividends, buybacks, and debt repayment, is at 12.73%, making it an attractive prospect for short-term investors.
Value drivers here are primarily the Buyback and Debt Paydown Yields as they signify the company’s intent and capability to return value to shareholders and manage debt.
As for the forecasts, if the current 12.73% Shareholder Yield persists, it’s safe to say the company focuses on returning value to shareholders and debt reduction. A Dividend Yield of 1.64% suggests that the company is cautious with direct payments to shareholders, possibly to reinvest in buying back its shares and paying the debt.
Earnings Preview For September Quarter
Seeking Alpha
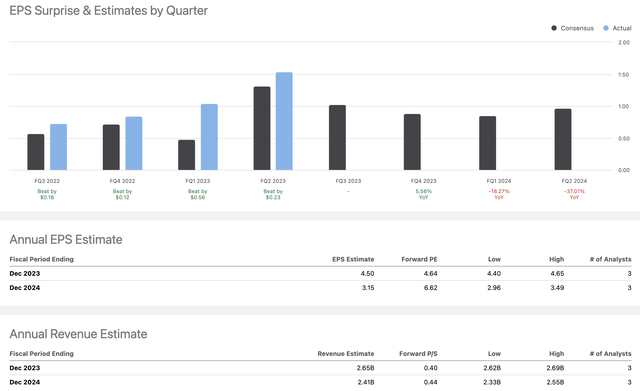
In the upcoming quarter ending September 2023, Wabash National Corporation has revenue forecasts that range from a low of $649 million to a high of $702.8 million. The median revenue forecast is $684.3 million; the average revenue forecast is slightly lower at $678.7 million.
When it comes to Earnings Per Share (EPS), the forecast ranges from a low of $0.97 to a high of $1.1. The median EPS forecast is $1, while the average is slightly higher at $1.02.
The average revenue forecast for June was higher at $739.98 million, and the EPS was also higher with an average of $1.31. The September quarter shows a decline in both revenue and EPS forecasts compared to June.
Therefore, based on this data, the financial outlook for Wabash National Corporation for September 2023 seems stable but slightly less optimistic than the June 2023 quarter.
Valuation
The objective of this valuation is to assess the intrinsic value of Wabash National Corporation’s stock to provide an investment recommendation.
Author analysis
Benchmark Companies:
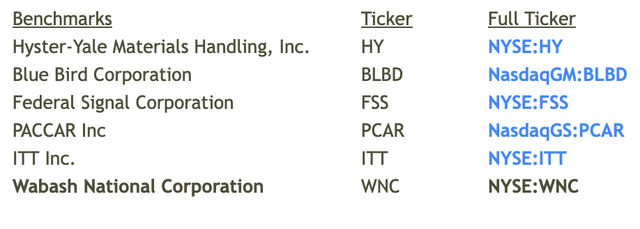
The chosen benchmark companies for this valuation model are Hyster-Yale Materials Handling (HY), Blue Bird Corporation (BLBD), Federal Signal Corporation (FSS), PACCAR Inc (PCAR), and ITT Inc. (ITT). These companies operate in similar sectors and markets as Wabash National Corporation (WNC), making them suitable for a comparative valuation. For example, FSS and ITT are known for their diversified industrial products, much like WNC. Furthermore, the chosen companies represent a good mix of EBITDA growth rates and margins, providing a holistic view of industry standards.
Select LTM EBITDA Multiple Analysis
Author analysis
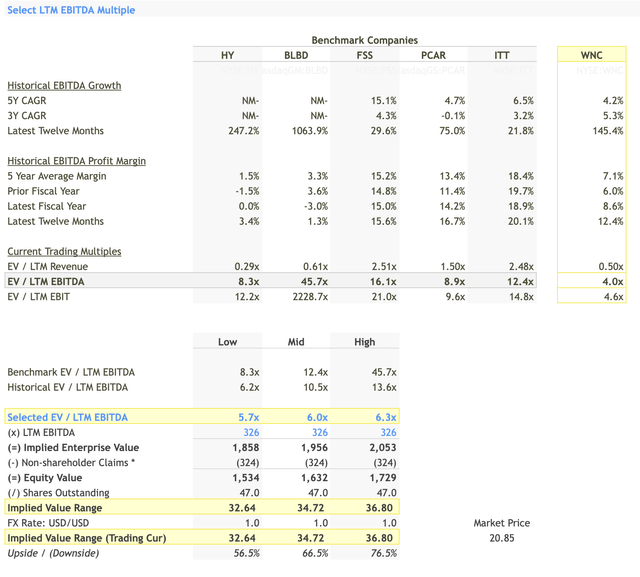
In the Last Twelve Months (LTM) EBITDA Multiple Analysis, Wabash exhibited an LTM EBITDA multiple of 4.0x, significantly lower than the range for the benchmark companies (8.3x to 45.7x). This deviation could signal that Wabash is undervalued compared to its peers. This observation is further corroborated by Wabash’s latest twelve months EBITDA growth of 145.4%, which, although substantial, is still less than BLBD’s 1063.9%. Another critical point is Wabash’s EBITDA margin for the last twelve months, standing at 12.4%, which is less than ITT’s 20.1% but higher than HY’s 3.4%.
The selected LTM EBITDA multiple range for Wabash, falling between 5.7x and 6.3x, appears conservative yet justifiable given the company’s performance metrics. This range results in an implied stock price between $32.64 and $36.80, which offers an upside of 56.5% to 76.5% from its current market price of $20.85.
Projected EBITDA Multiple Analysis:
Author analysis
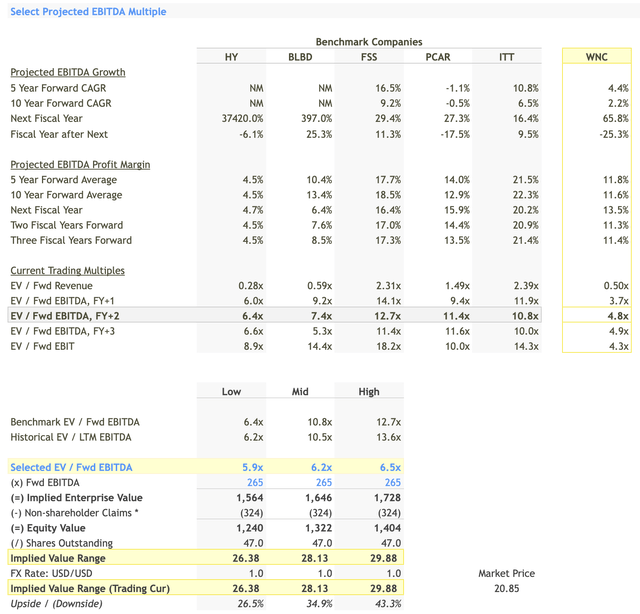
For the projected EBITDA multiple, Wabash stands at a forward multiple of 3.7x for the next fiscal year, which is again on the lower side compared to its benchmarks (6.0x to 14.1x). However, the company is expected to have a significant EBITDA growth of 65.8% for the next fiscal year, validating the potential for stock price appreciation.
The selected projected EBITDA multiple for Wabash ranges between 5.9x and 6.5x. This range, although conservative, fits within the context of the company’s growth prospects. The implied stock price, according to this forward multiple, would be between $26.38 and $29.88. This suggests an upside of 26.5% to 43.3% from the current market price.
Fair Value Range:

Author analysis
Considering both the LTM and projected EBITDA methods, we get a fair value stock price range for Wabash between $32.64-$36.80 (LTM) and $26.38-$29.88 (Projected). The midpoint values are $34.72 (LTM) and $28.13 (Projected), and the weighted average implied stock price comes to approximately $31.42.
Investment Recommendation:
The stock is currently trading at $20.85, and our valuation models suggest a weighted average fair value of $31.42, offering a substantial upside. Even at the lower end of our valuation range ($26.38), there’s a potential upside of 26.5%, and at the higher end ($36.80), the upside could go up to 76.5%.
Given the strong EBITDA growth rates and the conservative multiples chosen for the valuation, this provides a compelling case for Wabash being undervalued. The projected growth in EBITDA, coupled with a solid EBITDA margin, further strengthens the case for a ‘Buy’ recommendation.
In conclusion, based on the in-depth analysis of the LTM and projected EBITDA multiples, as well as the fair value range, Wabash National Corporation presents a significant upside potential, making it a ‘Buy’ from an investment standpoint.


