Monty Rakusen
Quick – answer me this: What’s the top-performing S&P 500 sector over the past month? Maybe the ETF titling of the article gave it away. Yes, the Materials Select Sector SPDR® Fund ETF (NYSEARCA:XLB) garners the top spot since early February. The ETF which comprises large-cap resources-focused companies has been on a heater amid continued strong economic growth numbers and a waning US Dollar Index. Fears of interest rates that will be ‘higher for longer’ just don’t seem to have the same bearish impact they did at times in 2023. For XLB and the Materials space, I assert that this fresh bout of momentum augers well for the month ahead.
Thus, I am upgrading the ETF from a hold to a buy.
US Equity Sector Performance: Materials Leads M/M
Seeking Alpha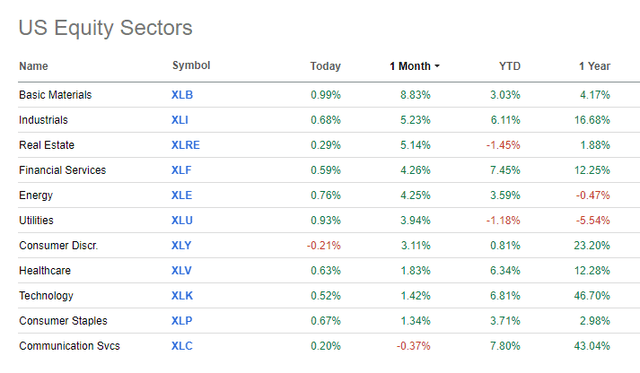
For background and according to SSGA Funds, XLB seeks to provide precise exposure to companies in the chemical, construction material, containers and packaging, metals and mining, and paper and forest products industries. Tracking the S&P 500 Materials sector index, the fund allows investors to take strategic or tactical positions at a more targeted level than traditional style-based investing.
I last wrote about XLB back near the market lows in March 2023. While the ETF is up 17% total return since then, it has sharply underperformed the S&P 500, which is higher by 30% (price only) over the past 12 months. As it stands, XLB is a large fund with more than $5 billion in assets under management as of March 5, 2024. Share-price momentum has improved markedly compared to just three months ago while its low 0.09% annual expense ratio should be viewed favorably by long-term investors.
Dividends, meanwhile, are not all that high with the allocation as a whole, but the 1.94% distribution rate is about half a percentage point above that of the SPX. Risk ratings are weak, though, given this cyclical ETF’s volatile history and a concentrated portfolio. Finally, liquidity metrics are robust considering its high average daily volume of more than 900,000 shares and a median 30-day bid/ask spread of just a single basis point.
Digging into the portfolio, the 5-star, Bronze-rated fund by Morningstar offers surprisingly high diversification across the style box. Fully half of the ETF is considered mid-cap with about an even mix of value and growth, though there is a slight bent toward the value style. With a forward price-to-earnings ratio of 21, it does not appear to be a steal of a deal, but the earnings growth in the S&P 500 should begin to favor areas away from the Magnificent Seven stocks, according to strategists at BofA Global Research.
XLB: Portfolio & Factor Profiles
Morningstar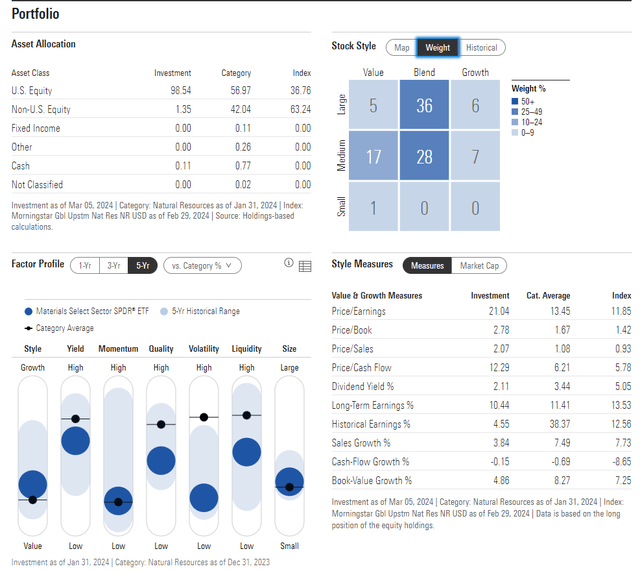
S&P 500 EPS Growth Seen Favoring Stocks Away from the Mag 7 Soon
BofA Global Research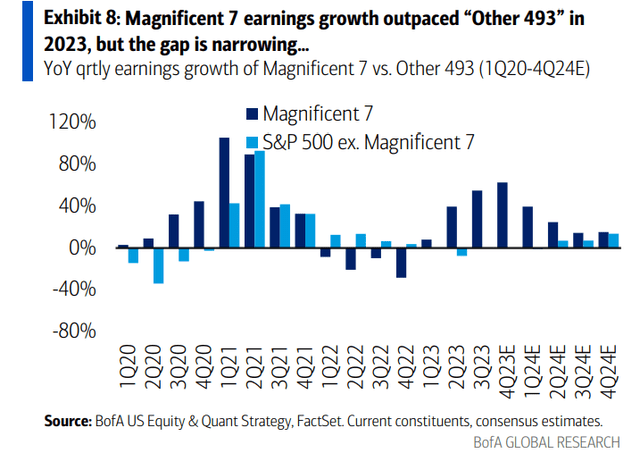
What makes XLB riskier than other sector funds is that there is a more than one-fifth weighting in a single stock. Linde plc (LIN) commands a high 22% of XLB. Moreover, that company has foreign headquarters (PLC denotes a UK firm). In all, the top 10 assets make up a high 66% of the ETF.
XLB: Holdings & Dividend Information
Seeking Alpha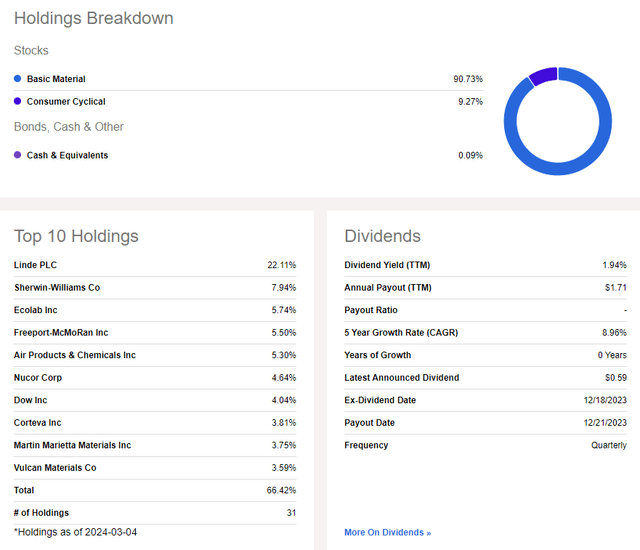
Seasonally, XLB tends to see about flat returns in March, but April is among the strongest months of the year, according to Seeking Alpha’s Seasonality tool. Gains have historically been prevalent from May through July, too. So, now could be an opportune time to get long shares.
XLB: Bullish Seasonality Ahead
Seeking Alpha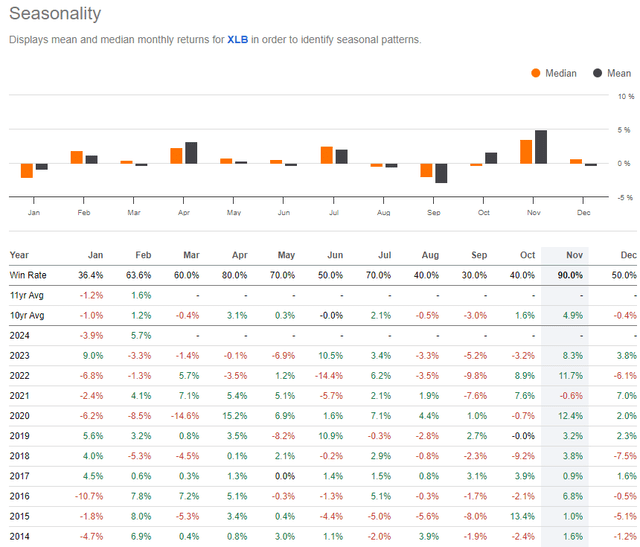
The Technical Take
What nudges me to upgrade XLB to a buy is its strong momentum as we approach the end of the first quarter. Notice in the chart below that the ETF recently broke out from major resistance in the area of $86. The fund had met selling pressure on a trio of occasions from early last year through the turn of the year. Support was seen just above $74, creating a, call it, $12 trading range. Given the breakout, we can arrive at an upside measure move price objective using the height of that pattern. Add $12 onto the former resistance at $86, and the chart would suggest that $98 is in the cards.
I think that is doable given that the RSI momentum oscillator at the top of the graph has confirmed the new high in price. What’s more, take a look at the long-term 200-day moving average – XLB held that trend indicator line like a champ on a pullback just a few weeks ago, further underscoring that the bulls are in charge. Finally, with a high amount of volume by price now underneath the latest share price, there should be ample support on pullbacks.
Overall, I see support at $86 and have an upside target of $98 on XLB.
XLB: Bullish Upside Breakout, Targeting $96
Stockcharts.com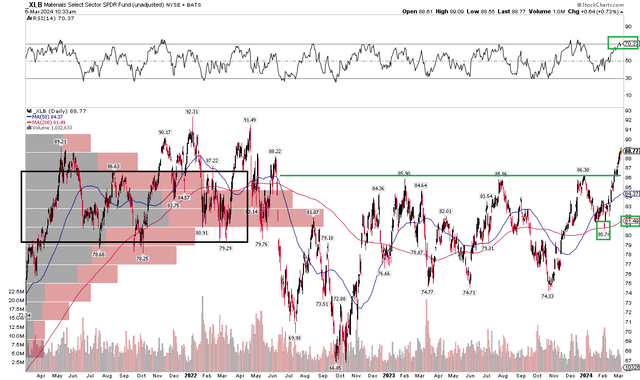
The Bottom Line
I am upgrading XLB from a hold to a buy. After months long underperformance, the Materials slice of the S&P 500 is leading equities to the upside.


